Contents
- 1 What is a Bar Chart?
- 2 Importance of Bar Charts in Trading
- 3 Components of a Bar Chart
- 4 Reading a Bar Chart
- 5 Setting Up Bar Charts on Trading Platforms
- 6 Interpreting Bar Charts for Market Analysis
- 7 Advantages and Disadvantages of Bar Charts
- 8 Advanced Techniques with Bar Charts
- 9 Common Mistakes When Using Bar Charts
- 10 Frequently Asked Questions (FAQs) about Bar Charts
What is a Bar Chart?
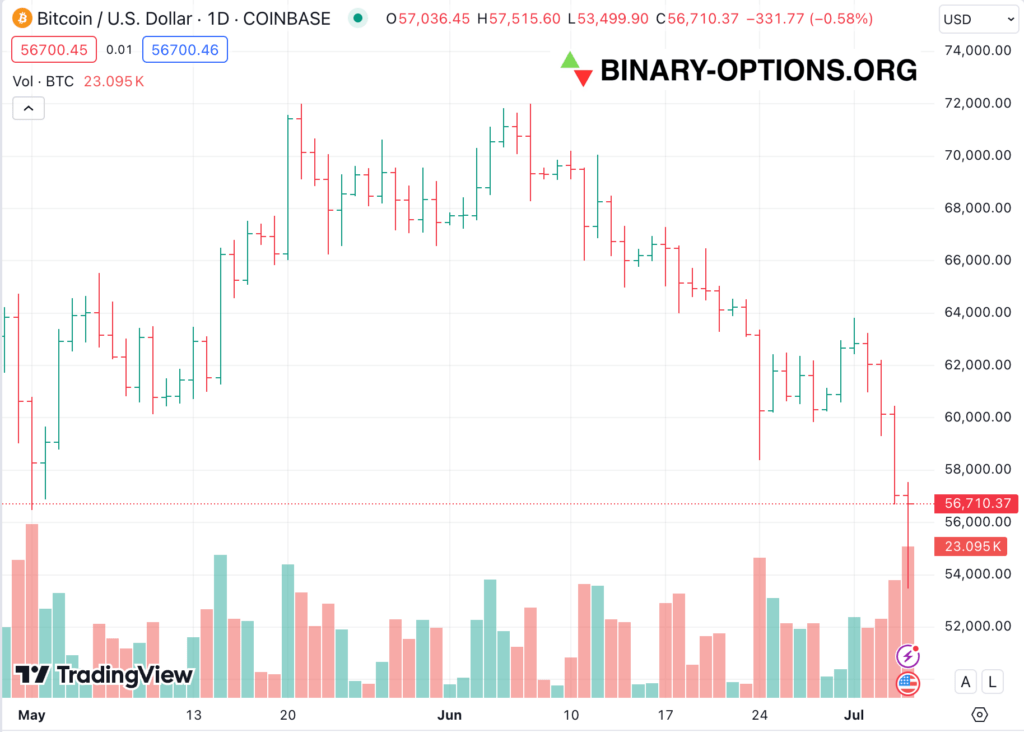
A bar chart is a type of financial chart used to represent the open, high, low, and close prices of an asset for a specific period. Each bar shows a single period, such as a day, and consists of a vertical line with small horizontal lines indicating the opening and closing prices. Bar charts can help traders analyzing price movements, market trends on price charts and make informed trading decisions.
Importance of Bar Charts in Trading
Bar charts are crucial for traders because they provide comprehensive information about price fluctuations within each trading period. This detailed view helps traders make informed decisions by understanding market volatility, trend direction, and potential reversal points. They are widely used in technical analysis to identify patterns, trends, and support and resistance levels.
Components of a Bar Chart
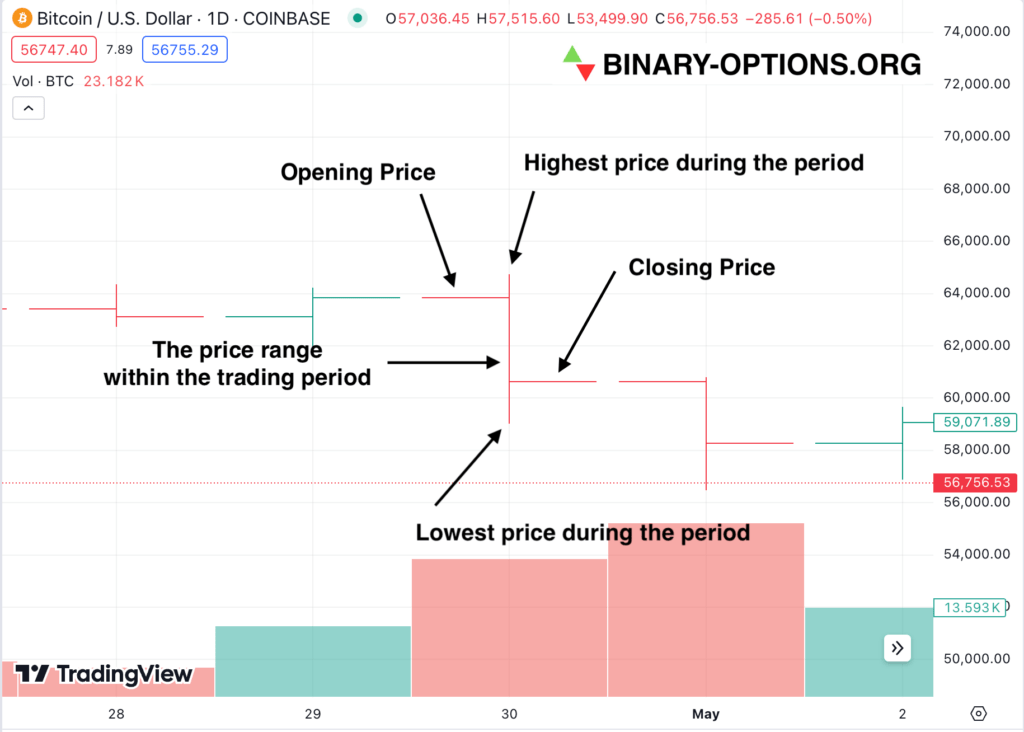
Vertical Line
- High and Low Prices: The top of the vertical line represents the highest price during the period, while the bottom represents the lowest price. This line indicates the price range within the trading period.
- Example: If a stock’s highest price during a day was $150 and the lowest was $140, the vertical line would span from $150 to $140.
Horizontal Lines
- Opening Price: A short horizontal line to the left of the vertical line indicates the opening price, showing where the price started at the beginning of the period.
- Example: If the stock opened at $142, the left horizontal line would be at this level.
- Closing Price: A short horizontal line to the right of the vertical line indicates the closing price, showing where the price ended at the close of the period.
- Example: If the stock closed at $148, the right horizontal line would be at this level.
Reading a Bar Chart
Identifying Price Movements
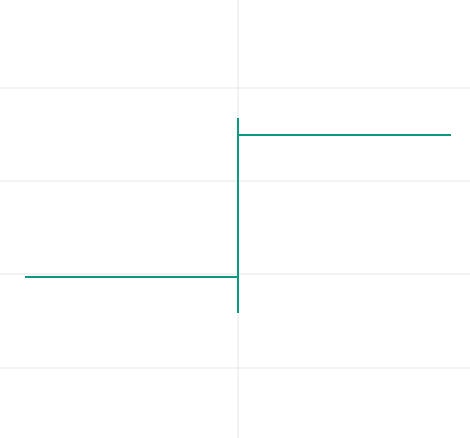
- Upward Movement: When the closing price is higher than the opening price, indicating a bullish period. This shows that the asset gained value during the period.
- Example: If the bar opens at $142 and closes at $148, it suggests the price moved upwards during the period.
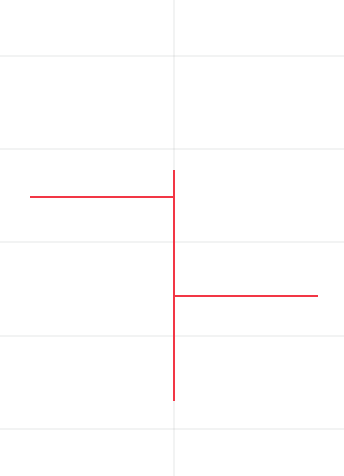
- Downward Movement: When the closing price is lower than the opening price, indicating a bearish period. This shows that the asset lost value during the period.
- Example: If the bar opens at $148 and closes at $142, it suggests the price moved downwards during the period.
Analyzing Volatility
- Bar Length: The length of the vertical line indicates the price range and market volatility. A longer bar shows higher volatility, while a shorter bar indicates lower volatility.
- Example: A long vertical line from $140 to $150 shows a wide price range and high volatility, suggesting significant price movement within the period.
Setting Up Bar Charts on Trading Platforms
Choosing the Right Platform
Select a trading platform that offers robust charting tools, real-time data, and customization options. Ensure the platform supports technical analysis with features like indicator overlays and multiple time frame views.
Customizing Bar Chart Settings
Adjust the time frame, colors, and indicators to match your trading strategy and preferences. Customize settings to highlight important price levels, trends, and patterns that are relevant to your analysis.
Adding Technical Indicators
Enhance your bar chart analysis by adding technical indicators such as moving averages, Bollinger Bands, and Relative Strength Index (RSI). These indicators provide additional insights into price trends and market conditions.
- Example: Adding a 50-day moving average can help identify the long-term trend, while Bollinger Bands can indicate volatility and potential breakouts.
Saving and Exporting Chart Data
Save and export your bar chart data for further analysis or record-keeping. This feature is useful for tracking your trading performance over time and reviewing past trades to improve future strategies.
Interpreting Bar Charts for Market Analysis
Identifying Trends
- Trend Direction: Use the direction of the bars to determine the trend. An upward trend is indicated by consecutive bars with higher highs and higher lows, while a downward trend is indicated by consecutive bars with lower highs and lower lows.
- Example: A series of bars with increasing highs and lows suggests an upward trend, indicating a bullish market sentiment.
Spotting Support and Resistance Levels
- Support Levels: Identify price points where the asset tends to stop falling and rebounds. These levels act as a floor, preventing the price from falling further.
- Example: If a stock repeatedly finds support at $140, this level acts as a floor for the price, suggesting strong buying interest at this level.
- Resistance Levels: Identify price points where the asset tends to stop rising and declines. These levels act as a ceiling, preventing the price from rising further.
- Example: If a stock repeatedly faces resistance at $150, this level acts as a ceiling for the price, suggesting strong selling interest at this level.
Recognizing Patterns
- Bar Patterns: Look for patterns such as inside bars (where the current bar’s high and low are within the previous bar’s range) and outside bars (where the current bar’s high and low exceed the previous bar’s range).
- Example: An inside bar pattern can indicate consolidation before a breakout, while an outside bar may signal a significant price reversal.
- Reversal Patterns: Identify patterns that suggest a reversal in the current trend, such as the bullish and bearish engulfing patterns.
- Example: A bullish engulfing pattern occurs when a small bearish bar is followed by a larger bullish bar, indicating a potential upward reversal.
Predicting Price Movements
- Historical Analysis: Use past bar chart data to predict future price movements. Recognize patterns and trends that suggest potential price directions.
- Example: A series of long bars with increasing closing prices may indicate a strong upward trend likely to continue.
- Technical Indicators: Combine bar charts with technical indicators to enhance prediction accuracy.
- Example: If the 50-day moving average crosses above the 200-day moving average (a golden cross), it signals a potential long-term uptrend.
Advantages and Disadvantages of Bar Charts
Advantages
- Detailed Information: Provides comprehensive data on opening, high, low, and closing prices.
- Volatility Insights: Helps traders understand market volatility and price range within each period.
- Pattern Recognition: Useful for identifying trends, patterns, and potential reversal points.
Disadvantages
- Complexity: Can be more complex to read compared to line charts due to the detailed information presented.
- Overwhelming for Beginners: The wealth of information can be overwhelming for novice traders who may find simpler charts easier to interpret.
Advanced Techniques with Bar Charts
Combining Bar Charts with Technical Indicators
Combine bar charts with indicators such as moving averages and Bollinger Bands for a more comprehensive analysis. This approach helps confirm trends and identify potential entry and exit points.
- Example: Using RSI along with bar charts to determine overbought or oversold conditions.
Overlaying Multiple Bar Charts
Overlay bar charts of different assets or time frames to compare performance and identify correlations. This technique is useful for portfolio analysis and market comparison.
- Example: Comparing the bar charts of two competing companies to identify relative performance trends.
Using Bar Charts for Long-term vs. Short-term Analysis
Adapt bar chart analysis techniques for long-term investments versus short-term trading strategies. Long-term analysis focuses on broader trends, while short-term analysis emphasizes immediate price movements.
- Example: Using weekly bars for long-term trend analysis and hourly bars for short-term trading decisions.
Common Mistakes When Using Bar Charts
Ignoring Volume Data
Volume data provides context to price movements. High volume confirms strong price action, while low volume may indicate weak price action. Ignoring volume can lead to misinterpretation of price movements.
- Example: A price increase on low volume may not be as significant as a price increase on high volume.
Overlooking Patterns
Failing to recognize common patterns can lead to missed trading opportunities or poor decision-making. Regularly review and study pattern recognition to enhance trading strategies.
- Example: Missing a head and shoulders pattern that indicates a potential trend reversal.
Misinterpreting Bar Lengths
Misinterpreting the length of bars can lead to incorrect conclusions about market volatility. Ensure proper understanding of bar lengths and their implications.
- Example: Assuming a short bar indicates stability without considering the context of previous bars.
Frequently Asked Questions (FAQs) about Bar Charts
What are the benefits of using bar charts in trading?
Bar charts provide detailed information about price movements within each period, helping traders understand market volatility and identify trends.
How do I choose the right time frame for my bar chart?
The time frame depends on your trading strategy. Short-term traders might prefer shorter time frames, while long-term investors might opt for longer periods.
Can bar charts be used for short-term trading?
Yes, bar charts are particularly useful for short-term trading due to the detailed price information they provide.
What are common indicators used with bar charts?
Common indicators include moving averages, Bollinger Bands, Relative Strength Index (RSI), and volume indicators.
By mastering the interpretation of bar charts, traders can gain deeper insights into market behavior, helping them make more informed and strategic trading decisions.
Further reading: