Contents
- 1 Type of Binary Options Strategies:
- 2 The most popular trading strategies for binary options trading:
- 3 Trend Strategy:
- 4 Support and Resistance Strategy
- 5 RSI and Bollinger Bands Strategy
- 6 Price Action with Candlesticks Strategy:
- 7 News Trading Strategy:
- 8 EUR/USD Strategy
- 9 5 Minutes Strategy
- 10 Conclusion
A binary option strategy involves a systematic approach to binary options trading, where the outcomes are confined to two possible results: a fixed gain or a loss. These strategies are crucial because they help traders make decisions with more accuracy, potentially increasing the likelihood of successful trades. The cornerstone of developing an effective method in this form of trading lies in understanding the market conditions and applying technical analysis to forecast the future movement of an asset’s price.
Successful trading strategy relies on the identification and execution of key signals in the market. For example, if a trader anticipates that the price of an asset will rise within a specific timeframe, they might place what is known as a “call” option. Conversely, if the expectation is for the price to decline, then a “put” option might be more appropriate. Each decision is based not merely on whim but is underpinned by a thorough analysis of market trends, economic indicators, and chart patterns.
Fundamental analysis and technical analysis are two primary methods used to assess trading opportunities. Fundamental analysis involves evaluating economic indicators, company earnings reports, and news releases to predict price movements. It provides insight into long-term trends and can be particularly useful when external events influence market prices. On the other hand, technical analysis focuses on statistical trends gathered from trading activity, such as price movement and volume. Using various tools like moving averages, RSI, and Fibonacci retracements, traders can find specific points of entry and exit, thereby maximizing their chances of executing a profitable trade.
Another crucial aspect of trading strategies involves the management of risk. A defined risk strategy, where the trader knows exactly how much they stand to lose or gain before entering a trade, helps maintain control over the trading process. Setting limits on the amount to be invested in each trade and the number of trades executed within a certain period can help preserve trading capital and reduce the emotional impact of trading.
Timeframe selection is also integral to building a strategy. Different time frames can influence the trading style, with options ranging from very short 60-second expiries to longer periods such as end-of-day or even end-of-month expiries. The choice of expiry time should align with the analysis used; for example, short-term trends might be better suited for shorter expiries, while long-term trends might necessitate a longer time frame to provide sufficient movement for a profitable outcome.
Mastering the art of trading with a strategies means developing a solid plan that includes an analytical approach to market trends, meticulous risk management, and an adaptable trading system. While inherently risky, the systematic application of a well-thought-out trading strategy can significantly enhance the likelihood of consistent profitability. The goal is not merely to make random predictions but to execute trades based on calculated and informed decisions that align with carefully considered pre-set criteria. This disciplined approach can help traders navigate the complexities of the market and achieve sustained success.
Type of Binary Options Strategies:
- Technical Analysis Strategies: These strategies rely on past price data and chart patterns to predict future price movements. This involves using indicators and tools to analyze charts for potential entry and exit points.
- Trend-Following Strategies: As the name suggests, these strategies focus on capitalizing on existing trends in the market. Traders aim to identify trends (upward or downward) and place trades that align with that momentum.
- Reversal and Retracement Strategies: These strategies look for potential reversals in trends or retracements within a trend. This could involve identifying support and resistance levels to predict price bounces or reversals.
- Momentum and Volatility Strategies: These strategies focus on markets with strong price movements (momentum) or high volatility. Traders aim to identify assets with significant price swings and capitalize on that movement (either up or down) before the trend changes.
- Risk Management Strategies: Regardless of the specific trading approach, risk management is crucial. This includes techniques like position sizing, stop-loss orders, and setting trading limits to minimize potential losses.
The most popular trading strategies for binary options trading:
Trend Strategy:
Often described as “the trend is your friend,” this strategy involves identifying the direction in which the market is moving and trading in alignment with it. Beginners can use technical analysis tools like moving averages to detect trends. If the market is in an uptrend, consider buying call options. Conversely, in a downtrend, put options might be the way to go.
Understanding Trend Strategy
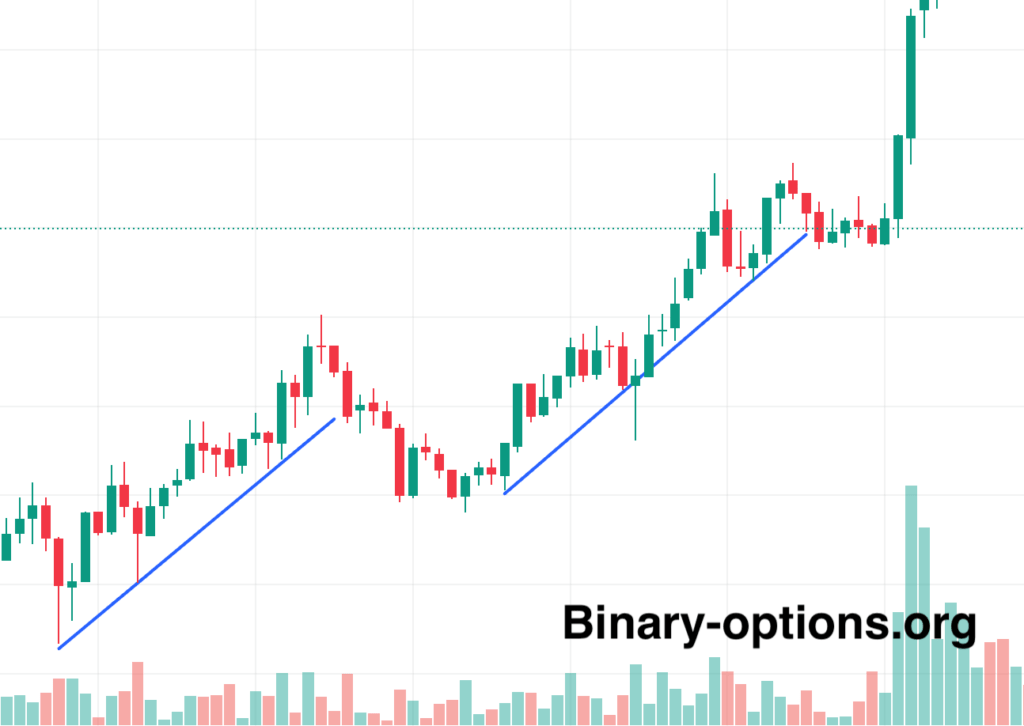
The Trend Strategy in binary options trading is based on the fundamental principle of identifying the overall direction of the market or a specific asset’s price movement and making trades based on the assumption that the existing trend will continue. This strategy is underpinned by the market axiom “the trend is your friend,” suggesting that it’s often safer and potentially more profitable to trade in the direction of the trend rather than against it.
Trends in the market can be categorized into three types:
- Uptrends: are characterized by higher highs and higher lows, indicating that the overall market sentiment is bullish.
- Downtrends: Marked by lower highs and lower lows, showing that the market sentiment is bearish.
- Sideways Trends: Where the price moves within a relatively stable range without significant upward or downward movement, indicating indecision in the market.
Example of Trend Strategy Application
Imagine you’re trading a binary option on a stock. You notice that over the past few weeks, the stock has been making consistent higher highs and higher lows. This pattern suggests an uptrend, signaling that buying call options (predicting that the price will be higher at the expiry time) could be a profitable strategy.
To apply this strategy, you might wait for a slight pullback in the price (a small move against the trend), which often happens as markets don’t move in a straight line. Buying a call option during a pullback in an uptrend can provide a more favorable entry point, increasing the potential profitability of the trade.
Tips to Apply the Trend Strategy
- Use Technical Analysis Tools: Implement tools like moving averages to help identify the trend. For instance, if the price is above the moving averages, it may indicate an uptrend.
- Identify Support and Resistance Levels: Knowing where these levels are can help you understand where the price might experience pullbacks or breakthroughs, providing strategic entry and exit points.
- Monitor Economic Indicators and News: External factors can influence market trends. Being aware of significant economic events or news can help you anticipate changes in the trend direction.
- Practice Patience and Discipline: Successful application of the trend strategy requires patience to wait for clear trends to develop and discipline to not trade against the trend without significant evidence.
- Use a Demo Account to Practice: Before applying the trend strategy with real money, practice on a demo account to get a feel for identifying trends and making trades based on those trends.
By applying the trend strategy thoughtfully, traders can increase their chances of making profitable trades in binary options. However, it’s crucial to remember that no strategy guarantees success in every trade, and risk management principles should always be followed to protect your investment.
Support and Resistance Strategy
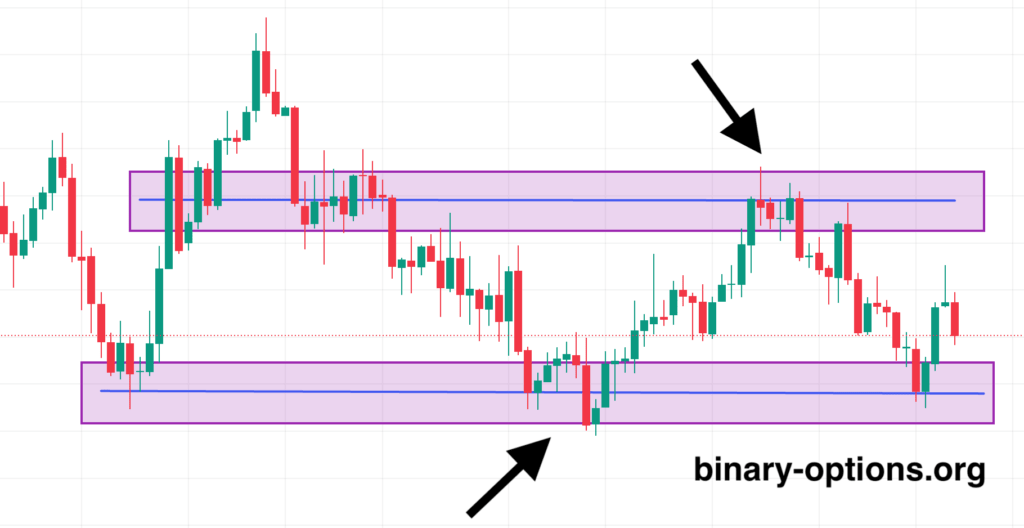
Support and resistance levels are like the floors and ceilings of the market; prices tend to bounce off these levels. By identifying these levels through chart analysis, beginners can trade binary options by predicting whether the price will rebound off these levels (support or resistance) or break through them. This strategy is particularly useful in range-bound markets.
Understanding Support and Resistance
The Support and Resistance Strategy in binary options trading revolves around identifying specific price levels on charts that historically have prevented the price of an asset from moving in a particular direction. These levels act as psychological barriers for market participants and can significantly influence the asset’s future price movement.
- Support is a price level where a downtrend can be expected to pause due to a concentration of demand. As the price of an asset drops, demand for the asset increases, thus forming a “support” level.
- Resistance is the opposite of support; it’s a price level where a trend can pause or reverse due to a concentration of selling. As the price of an asset rises, sellers begin to outnumber buyers, creating a “resistance” level.
Example of Support and Resistance Strategy Application
Imagine you’re analyzing the chart of a particular currency pair, and you identify a price level that the pair has tried to surpass multiple times but has failed each time. This level is known as resistance. You notice that each time the price hits this level, it starts to decline. Conversely, there’s a level below that the price drops to but consistently bounces back up from – this is your support.
In applying this strategy, you might place a “put” binary option (betting that the price will fall) when the price approaches the resistance level, expecting it to drop again. Similarly, you might place a “call” option (betting that the price will rise) when the price touches the support level, predicting a bounce back.
Tips to Apply the Support and Resistance Strategy
- Identify Clear Support and Resistance Levels: Use historical price data to find levels where the price has consistently bounced back or reversed. The more times the price has touched these levels without breaking through, the stronger they are considered.
- Use Technical Analysis Tools: Incorporate tools like trendlines, Bollinger Bands, and moving averages to help identify potential support and resistance levels.
- Look for Confirmation: Before placing a trade based on a support or resistance level, look for confirmation signals that the price is respecting these levels, such as candlestick patterns (e.g., a pin bar at a resistance level).
- Consider the Strength of the Level: The more times a level has been tested and held, the stronger it is considered. However, remember that once a strong level is broken, it can act as the opposite type of barrier (i.e., old resistance can become new support and vice versa).
- Combine with Other Strategies: Support and resistance levels can be more effective when combined with other trading strategies or indicators, such as the RSI or MACD, to confirm the trend’s strength or weakness at these levels.
- Practice on a Demo Account: Like any trading strategy, it’s beneficial to practice identifying and trading based on support and resistance levels on a demo account before risking real money.
- Be Aware of False Breakouts: Sometimes, the price might briefly break through a support or resistance level and then reverse. These “false breakouts” can provide trading opportunities but require quick, responsive trading strategies and risk management.
Implementing the Support and Resistance Strategy requires careful observation and the ability to react quickly to changes in the market. It’s also important to remember that no strategy guarantees success, and traders should always be prepared to manage their risk accordingly.
RSI and Bollinger Bands Strategy
The RSI (Relative Strength Index) and Bollinger Bands are both popular technical analysis tools used by binary options traders to gauge market volatility and potential price reversals. Combining these tools can provide a powerful strategy for trading. Here’s an in-depth look at how to use this strategy effectively.
Understanding RSI and Bollinger Bands
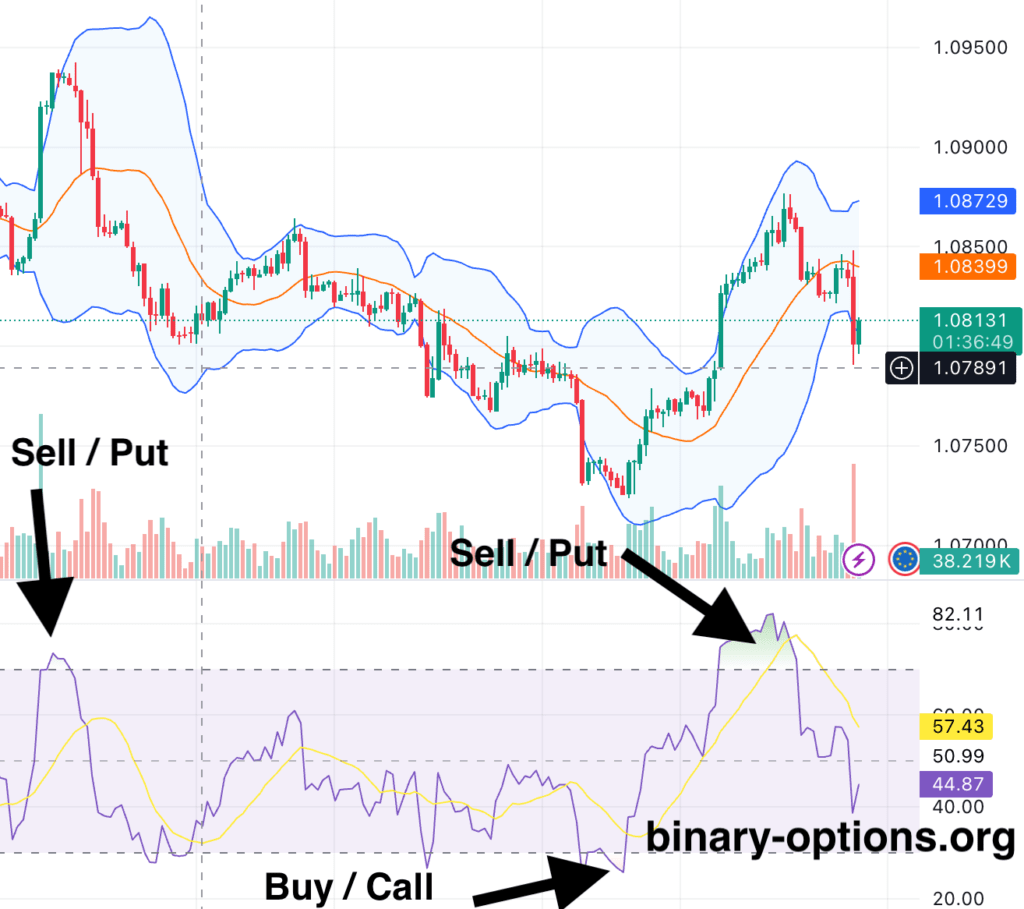
The RSI is a momentum oscillator that measures the speed and change of price movements, signaling overbought or oversold conditions. Bollinger Bands consist of a middle band being an N-period simple moving average (SMA) and two outer bands at two standard deviations away from the SMA, highlighting the volatility around the price. By combining these two, traders can identify potential entry points; for instance, a trader might look for the RSI to indicate an overbought condition (typically above 70) with the price touching the upper Bollinger Band, signaling a potential reversal and an opportunity to buy a put option. Conversely, an oversold condition (RSI below 30) with the price at the lower Bollinger Band could indicate a good time to buy a call option.
- RSI (Relative Strength Index): A momentum oscillator that measures the speed and change of price movements on a scale of 0 to 100. Traditionally, RSI values over 70 indicate an overbought condition (potentially overvalued) where a price correction could happen. Conversely, RSI values under 30 indicate an oversold condition (potentially undervalued), suggesting a price reversal to the upside might occur.
- Bollinger Bands: A technical analysis tool defined by a set of trendlines plotted two standard deviations (positively and negatively) away from a simple moving average (SMA) of a security’s price but that can be adjusted to user preferences. Bollinger Bands help measure market volatility and identify “overbought” or “oversold” conditions.
Example of RSI and Bollinger Bands Strategy
Suppose you are trading a particular asset, and its price has been in a downtrend. You observe the following:
- The RSI dips below 30, indicating the asset might be oversold.
- Simultaneously, the asset’s price touches or breaks through the lower Bollinger Band.
This scenario suggests a potential upward reversal in price, making it a potential point to place a “call” option, predicting the price will rise.
Conversely, if the RSI goes above 70 (indicating an overbought condition) and the price touches or breaks through the upper Bollinger Band, it might be a good opportunity to place a “put” option, predicting the price will fall.
Tips to Apply the RSI and Bollinger Bands Strategy
- Wait for Confirmation: Before placing a trade, wait for both the RSI to indicate an overbought or oversold condition and for the price to interact with one of the Bollinger Bands. This dual confirmation increases the likelihood of a successful trade.
- Look for Price Patterns: Use price patterns (like double tops or bottoms) in conjunction with RSI and Bollinger Bands for stronger trade signals.
- Adjust the Settings: Depending on your trading style and the asset you’re trading, you might need to adjust the settings of the Bollinger Bands and RSI. For instance, a longer period for the SMA in Bollinger Bands can provide a smoother band that might be more suitable for identifying longer-term trends.
- Combine with Other Indicators: For additional confirmation, consider using other indicators like the MACD or moving averages. This can help filter out false signals.
- Practice with Historical Data: Backtest your strategy using historical data to see how it would have performed in different market conditions. This can help refine your approach before using it in live trading.
- Be Mindful of Market News: Sudden news events can cause significant price swings that might not be predicted by technical analysis alone. Always be aware of the economic calendar and news events that might affect your trading assets.
Implementing the RSI and Bollinger Bands strategies requires careful observation, patience, and practice. While this strategy can be highly effective, it’s important to remember that all trading involves risk, and there’s no guarantee of success. Therefore, traders should use risk management practices and only invest capital they can afford to lose.
Price Action with Candlesticks Strategy:
This strategy emphasizes the importance of understanding candlestick patterns and what they indicate about market sentiment in order to predict future price movements without relying on technical indicators. For beginners, focusing on a few basic patterns, such as the hammer, engulfing patterns, and shooting star can be a good start. These patterns, when occurring at key support or resistance levels, can give strong signals about potential market reversals or continuations. For example, a bullish engulfing pattern near a support level might suggest a buying opportunity (call option), while a bearish engulfing pattern near a resistance level could indicate a selling opportunity (put option).

The Price Action with Candlesticks strategy is a powerful approach in binary options trading, focusing on the analysis of basic price movement without the use of indicators. This strategy relies heavily on candlestick patterns, which are specific formations created by the movement of an asset’s price, to predict future price movements. Here’s a deeper look into this strategy and how to effectively implement it.
Understanding Price Action and Candlestick Patterns
Price action trading involves understanding the historical movements of an asset’s price to forecast future price direction. Candlestick patterns, originating from Japan over 100 years ago, are the primary tool for this strategy. Each candlestick provides visual insights into market sentiment by displaying an asset’s opening, closing, high, and low prices within a specific timeframe.
Key Candlestick Patterns
Some of the most commonly used candlestick patterns in binary options trading include:
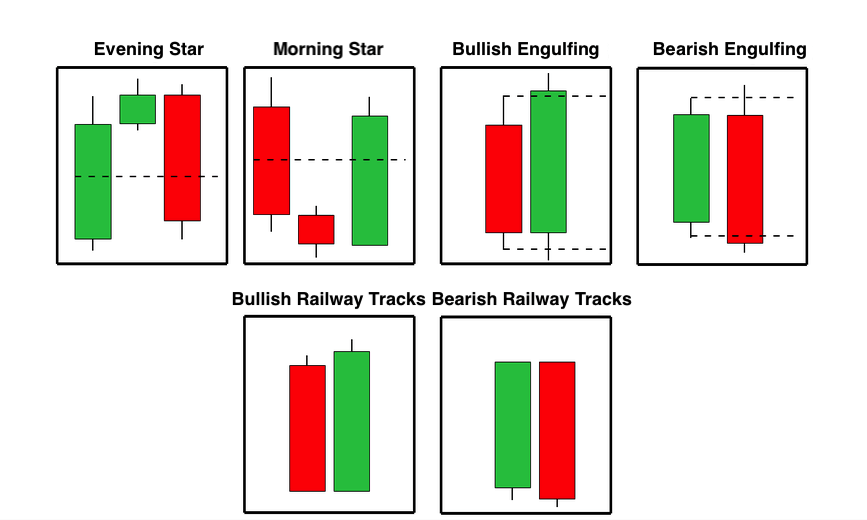
- Bullish Engulfing: Indicates a potential upward movement. It occurs when a small bearish candle is followed by a larger bullish candle that completely engulfs the previous candle.
- Bearish Engulfing: Suggests a potential downward movement. It occurs when a small bullish candle is followed by a larger bearish candle that completely engulfs the previous candle.
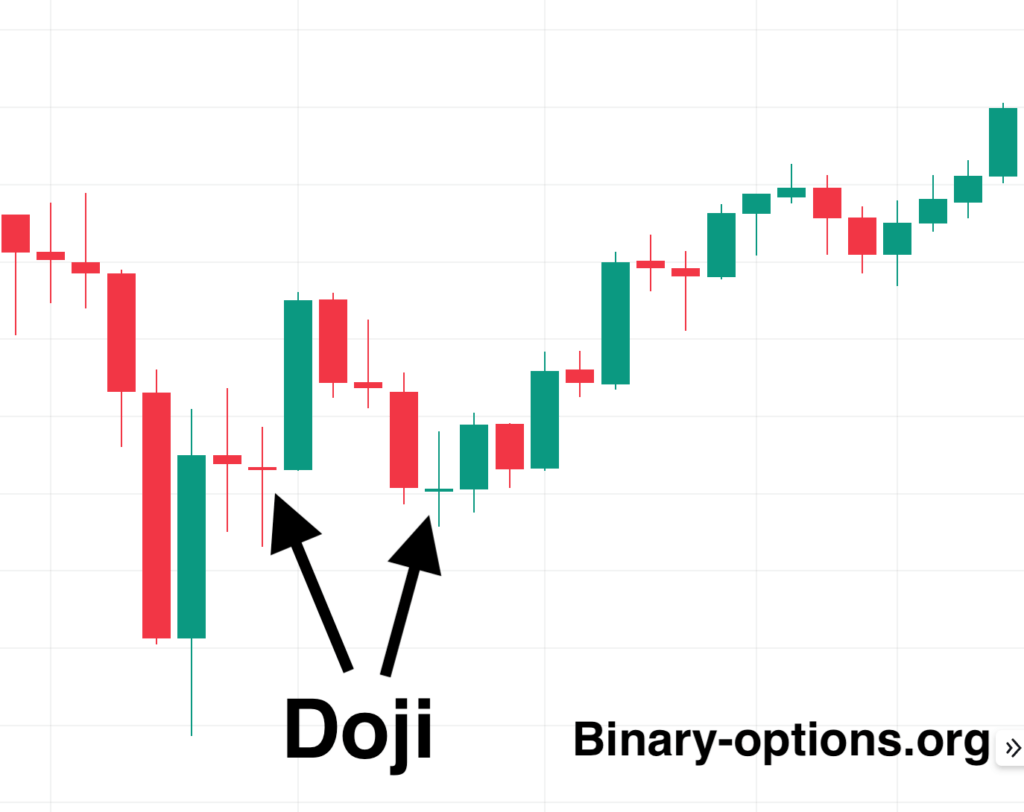
- Doji: Indicates indecision in the market. It occurs when an asset’s opening and closing prices are virtually the same, resulting in a cross-like candlestick.
- Hammer and Hanging Man: The Hammer (a bullish reversal pattern) and Hanging Man (a bearish reversal pattern) have small bodies, little to no upper wick, and long lower wicks, signaling potential reversals.
Example of Applying Price Action with Candlesticks Strategy
Suppose you are monitoring a specific asset and notice a Bullish Engulfing pattern forming at a key support level after a downtrend. This is a strong signal that the price might start to reverse upwards. Based on this pattern, placing a “call” option with an expiration time that gives the market enough room to reflect the anticipated upward movement could be a profitable decision.
Tips to Apply the Strategy
- Support and Resistance Levels: Combine candlestick patterns with support and resistance levels for stronger signals. Patterns forming at these key levels are more likely to result in significant price movements.
- Wait for Confirmation: After identifying a potential candlestick pattern, wait for the next candle to confirm the direction before entering a trade. This reduces the likelihood of false signals.
- Timeframe Consideration: Different timeframes can show different market behaviors. Practice with various timeframes to find which one aligns best with your trading strategy.
- Volume as a Confirmatory Indicator: While focusing on price action, observing trading volume can provide additional confirmation. A pattern accompanied by high volume is more likely to be reliable.
- Practice and Patience: Price action trading requires practice to recognize patterns quickly and accurately. Be patient and wait for clear signals before entering trades.
- Risk Management: Always use proper risk management techniques. Decide on a maximum percentage of your capital that you are willing to risk on a single trade and stick to it.
- Keep Learning: There are many candlestick patterns beyond the basics. As you gain experience, continue learning about more complex patterns and how they can indicate potential market movements.
Price Action with Candlesticks Strategy is highly regarded for its simplicity and effectiveness. However, like all trading strategies, it’s not foolproof. Continuous learning, practice, and a disciplined approach to risk management are key to succeeding with this strategy in binary options trading.
Bullish Engulfing
The Bullish Engulfing pattern is a significant indicator within the realm of technical analysis, suggesting a potential reversal from a downtrend to an uptrend. It is particularly noteworthy for traders focusing on price action and candlestick patterns. This pattern consists of two candlesticks: the first is a smaller bearish (red or black) candlestick, fully engulfed by a larger bullish (green or white) candlestick that follows it. The key is that the second candlestick’s body covers the first candlestick’s body completely, indicating a shift in market sentiment from bearish to bullish.
Understanding Bullish Engulfing Pattern
This pattern occurs at the bottom of a downtrend or during a price pullback within an uptrend. The initial bearish candlestick reflects the continuation of the downtrend, with sellers pushing the price lower. However, the next day opens lower than the previous day’s close but then reverses sharply to close above the high of the first day. This sudden shift indicates that buyers have overtaken sellers, potentially leading to a reversal of the downtrend.
Example of Bullish Engulfing Pattern
Imagine a scenario in the EUR/USD currency pair where after a prolonged downtrend, on Day 1, you observe a small red candlestick that closes lower than it opens, reflecting the continuation of the bearish sentiment. On Day 2, the price opens below the previous day’s close (showing initial bearish continuation), but then, unexpectedly, it rallies throughout the day to close significantly higher than Day 1’s open, thus completely “engulfing” the body of Day 1’s candlestick.
Tips to Apply Bullish Engulfing Pattern Strategy
- Confirmation: Look for additional confirmation before acting on a Bullish Engulfing pattern. This could be in the form of a gap up the following day, higher volume on the engulfing day, or other technical indicators signaling an uptrend.
- Entry Point: Consider entering a trade at the open of the candle following the Bullish Engulfing pattern, especially if pre-market activity or the early trading suggests continued upward momentum.
- Market Context: Always consider the broader market context. Bullish Engulfing patterns are more reliable when they occur at significant support levels, after a clear downtrend, or in oversold conditions.
- Combination with Other Indicators: Enhance the reliability of the Bullish Engulfing pattern by combining it with other technical analysis tools, such as moving averages, RSI (Relative Strength Index), or MACD (Moving Average Convergence Divergence). For instance, a Bullish Engulfing pattern that forms with an oversold RSI reading might indicate a stronger likelihood of a bullish reversal.
Limitations
While the Bullish Engulfing pattern is a powerful tool for identifying potential market reversals, it is not foolproof. False signals can occur, and not all Bullish Engulfing patterns lead to sustained uptrends. Hence, it’s crucial to use this pattern in conjunction with sound risk management strategies and other technical analysis tools to validate trading signals. Additionally, traders should consider the overall market conditions and economic indicators that might affect the asset’s price movement beyond the pattern itself.
Bearish Engulfing
The Bearish Engulfing pattern is a crucial candlestick formation that signals a potential reversal from an uptrend to a downtrend. It is especially valuable for traders who rely on price action and candlestick analysis to make trading decisions. This pattern features two main components: a smaller bullish (green or white) candlestick that is fully engulfed by a subsequent larger bearish (red or black) candlestick. The essence of the Bearish Engulfing pattern is that the second candlestick’s body completely covers or engulfs the body of the first candlestick, indicating a strong shift in market sentiment from bullish to bearish.
Understanding Bearish Engulfing Pattern
This pattern typically appears at the peak of an uptrend or during a corrective rally within a downtrend. The first candlestick, being bullish, suggests that the uptrend is continuing as buyers push the price higher. However, the following day opens at or above the previous day’s close but then reverses direction sharply, closing below the low of the first day. This dramatic shift signifies that sellers have gained control, possibly heralding the start of a downtrend.
Example of Bearish Engulfing Pattern
Consider a scenario where, after a steady uptrend in the price of a particular stock, on Day 1, you observe a small green candlestick, indicating a continuation of the bullish trend. On Day 2, however, the stock opens above the previous day’s close (indicating initial bullish continuation) but experiences a significant sell-off during the day, closing well below the low of Day 1’s candlestick. This action forms a Bearish Engulfing pattern, signaling a potential reversal.
Tips to Apply Bearish Engulfing Pattern Strategy
- Confirmation: Before acting on a Bearish Engulfing pattern, seek additional confirmation. This could include a gap down on the following day, increased volume on the bearish engulfing day, or other technical indicators suggesting a downtrend.
- Entry Point: Consider initiating a short position or selling at the open of the candle following the Bearish Engulfing pattern, especially if the market shows signs of continued downward momentum in pre-market trading or early in the session.
- Market Context: Bearish Engulfing patterns are more potent when they occur after a clear uptrend, near resistance levels, or in overbought conditions. Their significance is enhanced when aligned with the overall market sentiment or fundamental analysis.
- Combination with Other Indicators: Strengthen the predictive power of the Bearish Engulfing pattern by combining it with other analytical tools, such as moving averages, RSI, or MACD. A Bearish Engulfing pattern accompanied by a bearish divergence in RSI or MACD can indicate a higher probability of a bearish reversal.
Limitations
While the Bearish Engulfing pattern is a powerful indicator for predicting downturns, traders should be aware of its limitations. False signals are possible, and not every Bearish Engulfing pattern leads to a prolonged downtrend. Thus, incorporating this pattern into a broader trading strategy that includes thorough risk management practices and other forms of technical and fundamental analysis is essential for minimizing risks and enhancing the likelihood of successful trades.
Doji Patterns
A Doji is a pivotal candlestick pattern that signals uncertainty and potential reversal in the market. It is characterized by a candlestick with a closing price very close to its opening price, despite trading activity occurring during the session. This results in a candlestick that has a small body and can have long or short shadows (wicks) extending from the top and bottom, indicating the range of trading prices throughout the period. The Doji is a visual representation of the tug-of-war between buyers and sellers where neither gains significant ground, signaling indecision.
Types of Doji Patterns
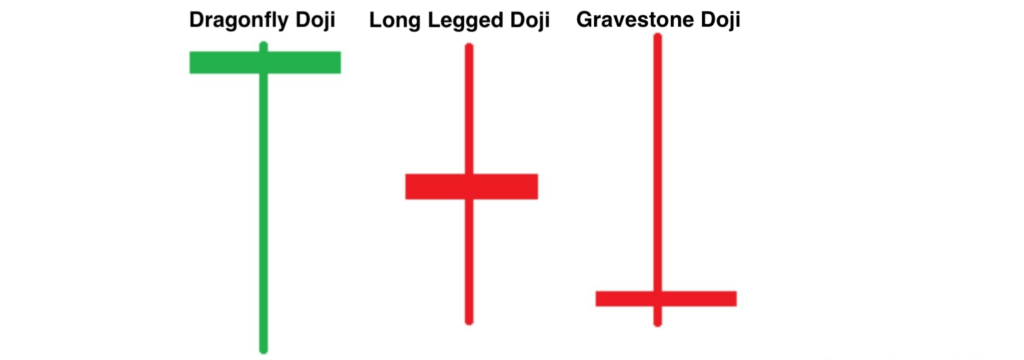
Standard Doji: The classic Doji, where the open and close are almost identical with varying lengths of shadows.
Long-Legged Doji: A Doji with long shadows, indicating a greater degree of indecision and volatility.
Dragonfly Doji: The opening, closing, and high prices are the same, with a long lower shadow. This often indicates potential bullish reversal.
Gravestone Doji: The opening, closing, and low prices are the same, with a long upper shadow. This typically signals a bearish reversal.
Example of Doji Pattern
Imagine a stock trading at $50 at the open, moving up to $55, down to $45, and then settling back at $50 at the close. This creates a Doji candlestick, indicating that despite the day’s volatility, there is a balance between buying and selling pressure.
Tips to Apply Doji Pattern Strategy
- Wait for Confirmation: The appearance of a Doji is a sign of market indecision but not a definitive indicator of future direction alone. Traders should wait for additional confirmation on subsequent candles or use other technical indicators before making a trade decision.
- Consider the Context: A Doji that appears at the top of an uptrend or the bottom of a downtrend can be more significant, suggesting potential reversal. The effectiveness of a Doji as a reversal signal is enhanced when it forms near resistance or support levels or when the market is overbought or oversold.
- Use with Other Indicators: Combining Doji patterns with other technical analysis tools like moving averages, RSI, or MACD can help confirm potential market reversals and improve decision-making. For instance, a Doji followed by a large bearish candle might confirm a reversal signal, especially if accompanied by high trading volume.
- Monitor the Volume: Higher trading volume on the confirmation candle following a Doji can provide additional evidence of a new market direction. Volume is a key indicator that can signify the strength behind the move that follows a Doji pattern.
Limitations
While Doji patterns are a useful tool for identifying potential reversals, they are not foolproof. False signals can occur, especially in highly volatile markets where price movements might lead to frequent Dojis without significant directional changes. As with all trading strategies, incorporating Dojis into a comprehensive trading plan that includes other forms of analysis and strict risk management practices is crucial for success.
Hammer pattern
The Hammer is a bullish reversal candlestick pattern that typically occurs at the bottom of a downtrend, signaling a potential turnaround in the market sentiment from bearish to bullish. It is characterized by a small real body at the upper end of the trading range, with a long lower shadow that is usually twice the size of the body, and little to no upper shadow. The hammer indicates that although there was selling pressure during the trading session, by the close, buyers were able to push the price back up towards the opening level, suggesting growing bullish sentiment.
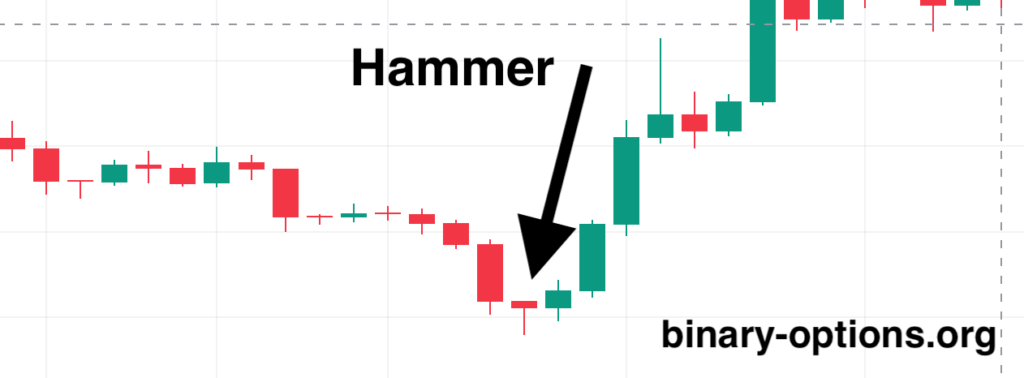
Example of a Hammer Pattern
Consider a scenario where a stock has been in a consistent downtrend for several weeks, trading from $100 down to $70. On a particular day, the price opens at $70, then drops significantly to $60 during the session, indicating continued bearish sentiment. However, by the end of the session, the price rallies and closes near the opening price at $69. This forms a Hammer candlestick, as the price was pushed up significantly from the lows, showing that buyers are starting to take control.
Tips to Apply the Hammer Strategy
- Wait for Confirmation: The presence of a Hammer pattern suggests a potential bullish reversal, but traders should seek confirmation before acting on it. This confirmation could come from a subsequent green candle (indicating a closing price higher than the opening price) on the following day, or from other bullish indicators or patterns.
- Check the Volume: For a Hammer to be considered a reliable signal, it should ideally occur with higher than average trading volume. Increased volume suggests that the move back up was supported by a substantial number of buyers, which can indicate stronger conviction in the price reversal.
- Use in Conjunction with Other Indicators: To increase the reliability of a Hammer signal, traders often use other technical analysis tools, such as moving averages, RSI (Relative Strength Index), or support levels. For instance, a Hammer forming near a major support level or a key moving average can provide additional evidence of a potential bullish reversal.
- Set Appropriate Stop Losses: To manage risk effectively, set stop-loss orders below the low of the Hammer’s shadow. This protects against the possibility of a false reversal signal and limits potential losses if the trend does not change as anticipated.
- Consider the Trend: While a Hammer can indicate a reversal, its effectiveness is higher when it occurs after a significant downtrend. A Hammer pattern that appears without a preceding downtrend may not carry the same weight or predictive value.
Limitations
The Hammer pattern, while a useful indicator of a potential market reversal, is not foolproof and should not be used in isolation. False signals can occur, particularly in markets with high volatility or when the pattern forms without significant preceding trends. Always consider the broader market context and corroborate the Hammer signal with other forms of technical analysis and indicators to enhance trading decisions and minimize risk.
Hanging Man pattern
The Hanging Man is a bearish reversal candlestick pattern that often appears at the top of an uptrend, signaling a potential shift from bullish to bearish market sentiment. It closely resembles the Hammer pattern in appearance but occurs in a different context. The Hanging Man has a small real body at the upper end of the trading range, a long lower shadow (at least twice the length of the body), and little to no upper shadow. This pattern suggests that despite strong selling pressure during the session, buyers were initially able to push prices back up, only for the closing price to settle near the opening, indicating weakening bullish momentum.
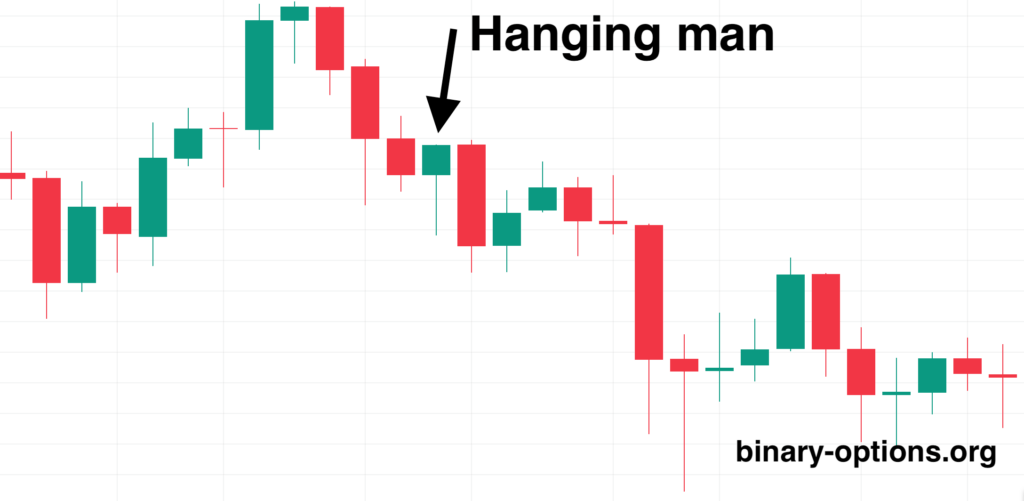
Example of a Hanging Man Pattern
Imagine a stock in a robust uptrend, moving from $50 to $70 over several weeks. On a specific day, after opening at $70, the price sharply falls to $60 during the trading session, suggesting a sudden increase in selling pressure. However, before the session ends, the price recovers, closing slightly above the opening at $71, forming a Hanging Man. This pattern indicates that despite the recovery, sellers are beginning to challenge the prevailing uptrend, potentially leading to a reversal.
Tips to Apply the Hanging Man Strategy
- Seek Confirmation: The appearance of a Hanging Man indicates potential bearish reversal, but confirmation is crucial before making trading decisions. Confirmation can come from a subsequent bearish candle (closing lower than the opening price) or other bearish signals in following sessions.
- Volume is Key: A reliable Hanging Man pattern often features higher trading volume, signifying that the selling pressure was significant. High volume during the formation of a Hanging Man adds credibility to the potential reversal signal.
- Complement with Technical Indicators: Enhancing the predictive power of the Hanging Man by using it in conjunction with other technical indicators, such as moving averages, RSI, or MACD, can provide a more comprehensive view of market conditions and potential reversals.
- Risk Management: Implementing stop-loss orders just above the high of the Hanging Man can help manage the risk. If the market does not reverse and instead continues the uptrend, this approach limits potential losses.
- Trend Context Matters: For the Hanging Man to be considered a valid bearish reversal signal, it must follow an established uptrend. A Hanging Man pattern without a preceding increase in price may not serve as a reliable indicator of a market reversal.
Limitations
While the Hanging Man can be a precursor to a market reversal, it’s not an infallible signal. False reversals are possible, especially in volatile markets or when the pattern forms without significant prior trends. The pattern should, therefore, be validated through additional analysis, including the examination of candlestick patterns that follow, the use of technical indicators, and the consideration of overall market conditions. As with all trading strategies, the use of a comprehensive approach that includes sound risk management practices is essential to navigate potential market reversals effectively..
News Trading Strategy:
This strategy capitalizes on the volatility that news releases can bring to the market. Economic announcements, earnings reports, and political events can have a substantial impact on asset prices. By staying informed about such events and understanding their potential effects, beginners can make trades based on the anticipated market direction following a news release.
Understanding the News Trading Strategy
The News Trading Strategy revolves around the premise that significant economic news and events can cause substantial volatility in the market, leading to predictable price movements that can be capitalized on. Traders who specialize in this strategy stay abreast of news releases such as economic data announcements, central bank decisions, or geopolitical events, and make trades based on their anticipated impact on financial markets.
This strategy is predicated on the idea that markets will react to news in predictable ways, depending on whether the news is positive or negative relative to market expectations. For binary options traders, this can mean placing trades that bet on the direction of the market following a news release. The strategy requires a good understanding of how different types of news affect markets and the ability to react quickly as news breaks.
Example of Applying the News Trading Strategy
Suppose the U.S. Non-Farm Payroll (NFP) report is about to be released, and it is widely anticipated to show a significant increase in employment. If the report indeed confirms a higher-than-expected job growth, the USD is likely to strengthen against other currencies. A news trader might place a call option on USD/JPY or USD/EUR, predicting that the dollar will rise following the announcement.
Conversely, if the NFP report is disappointingly lower than expected, indicating weakness in the job market, the trader might place a put option, betting on the dollar’s decline.
Tips to Apply the Strategy
- Stay Informed: Use economic calendars to track when significant news is scheduled for release. Be aware of the times and the expected impact of these announcements.
- Understand Market Expectations: It’s not just the news itself but how it compares to market expectations that drives price movement. Pre-release forecasts and consensus figures can provide a benchmark to gauge surprises or disappointments.
- Quick Execution: Markets move fast following news releases. Having a platform that allows for quick execution of trades is crucial.
- Risk Management: Given the high volatility, it’s essential to manage risk carefully. Consider using lower leverage and placing smaller bets to manage the risk of sudden market moves against your position.
- Practice Makes Perfect: Use a demo account to practice your news trading strategy without risking real money. This can help you get a feel for the market’s reaction to different types of news.
- Look for Overreactions: Often, the initial market reaction to news can be an overreaction, followed by a correction. If you can identify overreactions, there may be opportunities for profitable trades in the aftermath of news releases.
- Diversify: Don’t focus solely on one type of news or market. Economic indicators, political events, and corporate earnings can all provide trading opportunities.
Limitations
News trading in binary options can be highly profitable, but it also carries significant risks. Market reactions can be unpredictable, and slippage (the difference between the expected price of a trade and the price at which the trade is executed) can affect outcomes, especially in highly volatile conditions. Furthermore, some binary options brokers may restrict trading around news announcements due to the increased volatility.
To mitigate these risks, it’s essential to stay informed, practice disciplined risk management, and continually refine your strategy based on experience and market observation.
EUR/USD Strategy
The EUR/USD currency pair is one of the most liquid and widely traded pairs in the forex market. Trading strategies for this pair often involve both technical and fundamental analysis. Technical analysis might include using moving averages to identify trends, while fundamental analysis involves keeping track of economic news from the Eurozone and the United States.
One common strategy is to trade the pair around major economic announcements, such as interest rate decisions or employment reports. Traders look for increased volatility during these times and use it to their advantage. Combining the analysis of economic indicators with technical tools like the MACD or RSI can provide comprehensive trading signals.
5 Minutes Strategy
This strategy focuses on short-term trades with a 5-minute expiry. Traders use various indicators and analysis techniques to predict the price movement within this short period, aiming for quick profits.
For example, a trader might use the stochastic oscillator to identify overbought and oversold conditions within a 5-minute timeframe. Combining this with trend analysis can help identify optimal entry and exit points for short-term trades.
Conclusion
Implementing these binary options strategies requires practice and patience. Beginners should start with a demo account to hone their skills without risking real money. As with any investment, it’s important to remember that there is no guarantee of success in binary options trading, but employing these strategies can increase your chances of making informed and potentially profitable trades.
Further reading: