Contents
- 1 Understanding Heikin-Ashi Charts
- 2 History and Development
- 3 Importance in Binary Options Trading
- 4 Anatomy of Heikin-Ashi Candlesticks
- 5 Calculating Heikin-Ashi Candlesticks
- 6 Advantages of Using Heikin-Ashi Charts
- 7 Comparing Heikin-Ashi with Traditional Candlestick Charts
- 8 Key Patterns in Heikin-Ashi Charts
- 9 Using Heikin-Ashi Charts for Technical Analysis
- 10 Combining Heikin-Ashi with Other Indicators
- 11 Lessons from Failed Trades
- 12 Common Mistakes and How to Avoid Them
- 13 Advanced Tips for Mastering Heikin-Ashi Charts
- 14 Continuous Learning and Adaptation
- 15 Conclusion
- 16 Final Thoughts on the Use of Heikin-Ashi in Binary Options Trading
Heikin-Ashi charts are popular among binary options traders for their ability to smooth price data and reduce market noise in price charts. This comprehensive guide will delve into the intricacies of Heikin-Ashi charts, their patterns, and their practical applications in binary options trading.
Understanding Heikin-Ashi Charts
Heikin-Ashi, meaning “average bar” in Japanese, uses modified candlesticks to present price data. Unlike traditional candlestick charts, which show open, high, low, and close prices for a specific period, Heikin-Ashi charts use averaged values, making it easier to identify trends and reversals.

History and Development
The Heikin-Ashi technique, similar to traditional candlestick charts, has its roots in Japan. Developed centuries ago by Munehisa Homma, a Japanese rice trader, Heikin-Ashi has evolved to become a widely used tool in modern financial markets due to its ability to filter out market noise and provide a clearer view of market trends.
Importance in Binary Options Trading
Heikin-Ashi charts are particularly useful in binary options trading because they help traders make more informed decisions by providing a clearer picture of market trends. By smoothing out price fluctuations, these charts make it easier to spot potential trading opportunities and reduce the likelihood of being misled by temporary price spikes or drops.
Anatomy of Heikin-Ashi Candlesticks
Understanding the structure of Heikin-Ashi candlesticks is crucial for effectively using them in trading.
- The Body: The body of a Heikin-Ashi candlestick represents the range between the opening and closing prices. Due to the averaging method used, the bodies tend to be more uniform than traditional candlesticks, making trends more apparent.
- The Wicks (Shadows): The wicks, or shadows, of Heikin-Ashi candlesticks indicate the highest and lowest prices during the period. Longer wicks can indicate volatility, while shorter wicks suggest stability in the price movement.
Calculating Heikin-Ashi Candlesticks
Heikin-Ashi candlesticks are calculated using the following formulas:
- Open: (Open of previous bar + Close of previous bar) / 2
- Close: (Open + High + Low + Close) / 4
- High: Maximum of High, Open, or Close of the current period
- Low: Minimum of Low, Open, or Close of the current period
Advantages of Using Heikin-Ashi Charts
Heikin-Ashi charts offer several benefits that make them a valuable tool for traders:
- Smoothing Price Data: By averaging prices, Heikin-Ashi charts smooth out price fluctuations, providing a clearer view of the overall trend. This smoothing effect helps traders avoid being misled by temporary price spikes or drops.
- Reducing Market Noise: Market noise, or the random price movements that occur within a trading period, can make it difficult to identify true market trends. Heikin-Ashi charts reduce this noise, making it easier to see the underlying trend.
- Identifying Clear Trends: The uniform appearance of Heikin-Ashi candlesticks makes it easier to spot trends. A series of consecutive bullish or bearish candlesticks indicates a strong trend, while mixed candlesticks suggest a potential reversal or consolidation.
Comparing Heikin-Ashi with Traditional Candlestick Charts
Understanding the differences between Heikin-Ashi and traditional candlestick charts can help traders choose the right tool for their needs.
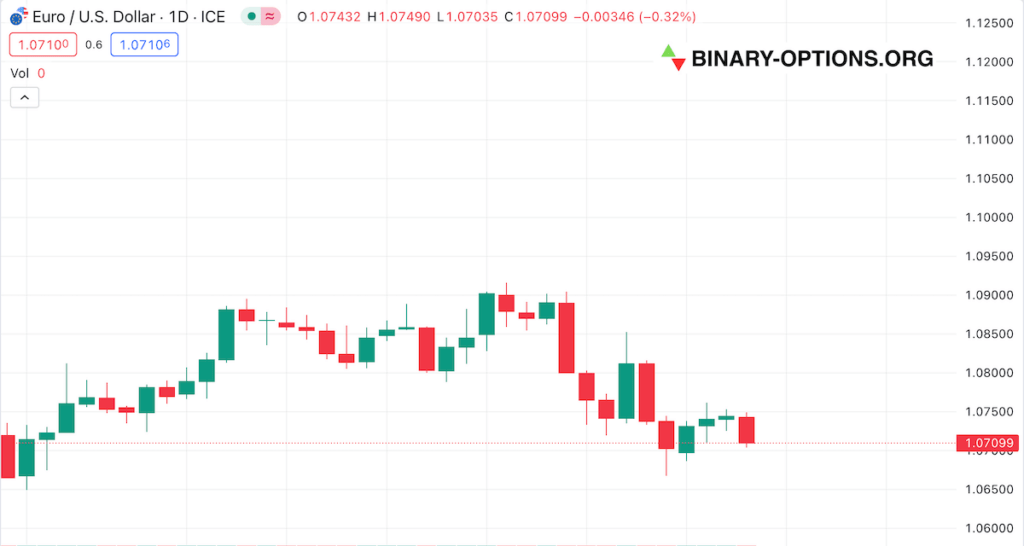
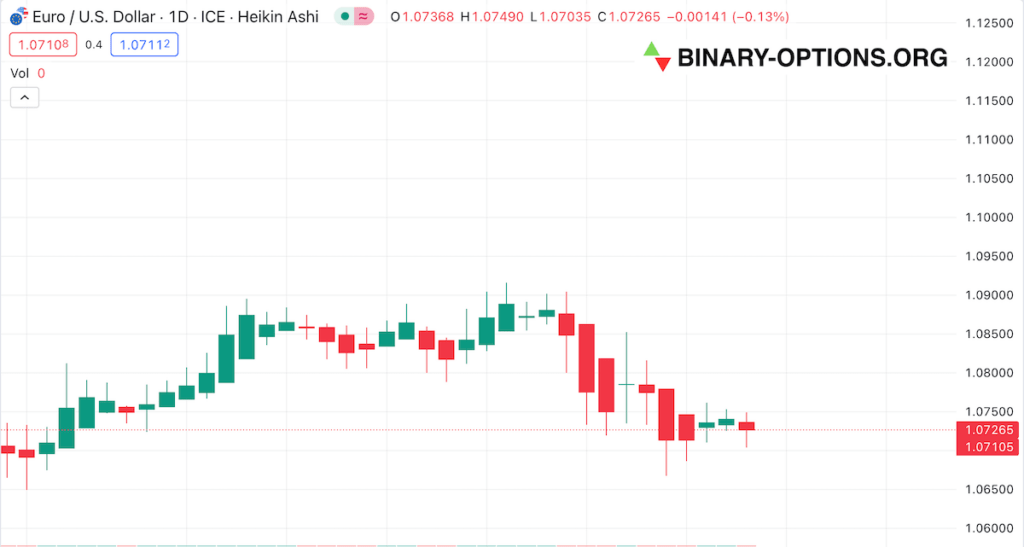
- Differences in Calculation: Traditional candlestick charts display actual open, high, low, and close prices for each period. In contrast, Heikin-Ashi charts use averaged values, which can sometimes lag behind actual price movements but provide a clearer picture of trends.
- Visual Differences: Heikin-Ashi candlesticks tend to be more uniform in appearance, with longer runs of consecutive bullish or bearish candlesticks. This uniformity makes it easier to identify trends and reversals compared to the more erratic appearance of traditional candlestick charts.
- Use Cases for Each Chart Type: While traditional candlestick charts are useful for short-term trading and identifying specific price points, Heikin-Ashi charts are better suited for identifying longer-term trends and reducing the impact of market noise.
Key Patterns in Heikin-Ashi Charts
Bullish Patterns
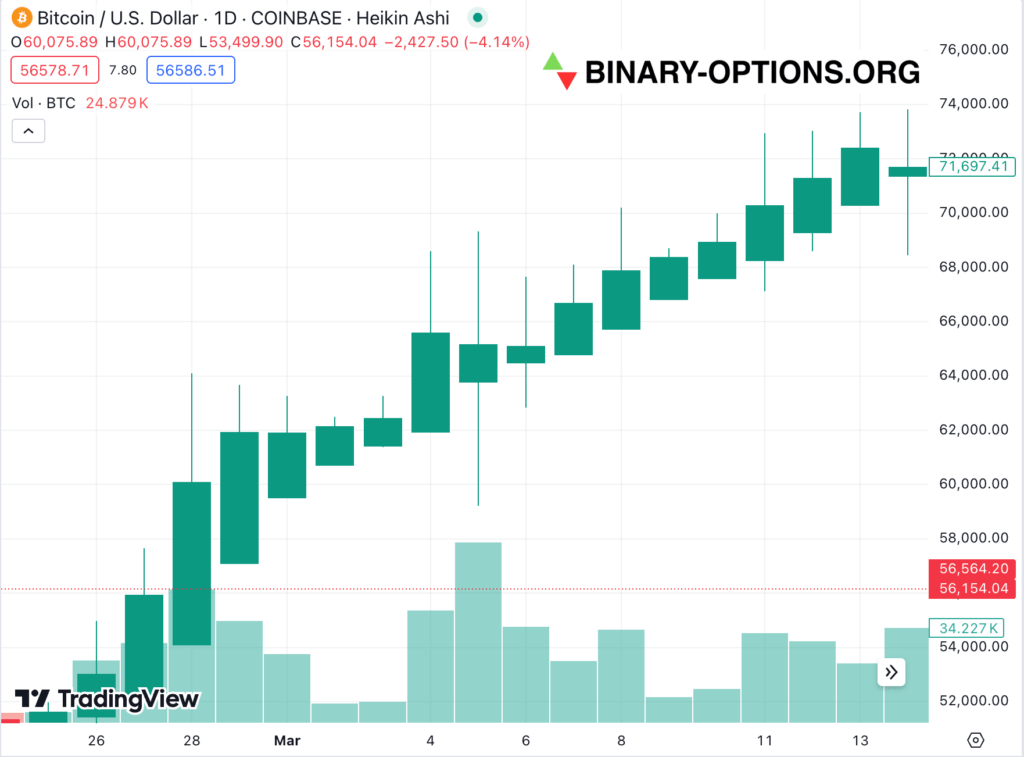
- Bullish Trend Continuation: A series of consecutive bullish (green or white) candlesticks with little or no lower wick indicates a strong upward trend. This pattern suggests the market is likely to continue moving higher.
- Bullish Reversal Patterns: A bullish reversal pattern occurs when a series of bearish candlesticks is followed by one or more bullish candlesticks with a higher close than the previous bearish candles. This pattern suggests a potential shift in momentum from bearish to bullish, indicating a possible buying opportunity.
Bearish Patterns
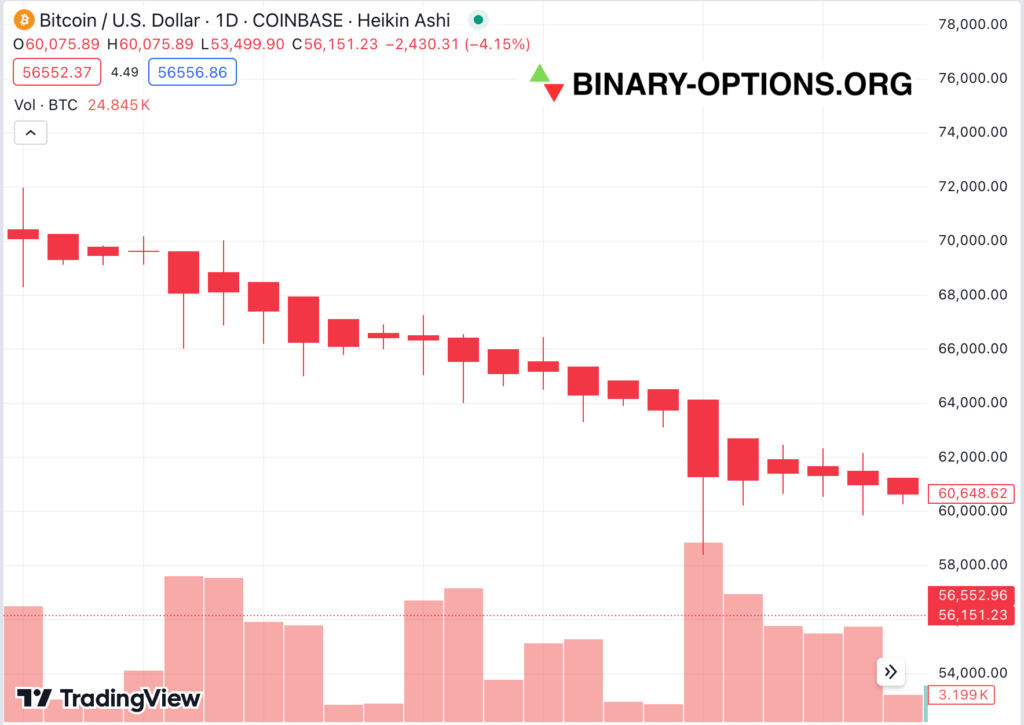
- Bearish Trend Continuation: A series of consecutive bearish (red or black) candlesticks with little or no upper wick indicates a strong downward trend. This pattern suggests the market is likely to continue moving lower.
- Bearish Reversal Patterns: A bearish reversal pattern occurs when a series of bullish candlesticks is followed by one or more bearish candlesticks with a lower close than the previous bullish candles. This pattern suggests a potential shift in momentum from bullish to bearish, indicating a possible selling opportunity.
Indecision Patterns
- Doji: A Doji is a candlestick with a very small body and long upper and lower wicks, resembling a cross. It suggests indecision in the market, where the opening and closing prices are nearly equal. Dojis can precede trend reversals or consolidations.
- Spinning Top: Similar to a Doji, a Spinning Top has a small body but with slightly longer wicks. It also indicates indecision and potential trend changes.
Using Heikin-Ashi Charts for Technical Analysis
Heikin-Ashi charts are invaluable for technical analysis, helping traders identify market trends and predict future movements. Here’s how:
- Identifying Trends: By analyzing the patterns and formations of Heikin-Ashi candlesticks, traders can identify ongoing market trends, whether bullish, bearish, or neutral. Trend identification is crucial for aligning trading strategies with the market direction.
- Spotting Reversals: Heikin-Ashi charts are particularly useful for spotting reversal patterns, which can indicate when a market trend is about to change direction. Recognizing these patterns helps traders enter or exit positions at optimal times.
- Continuation Patterns: Continuation patterns suggest that the current market trend will continue. Recognizing these patterns helps traders align their strategies with the ongoing trend, maximizing potential gains while minimizing risks.
Combining Heikin-Ashi with Other Indicators
For a more robust analysis, Heikin-Ashi patterns can be combined with other technical indicators. This integrated approach enhances the accuracy of market predictions. Here are some commonly used indicators alongside Heikin-Ashi:
- Moving Averages: Moving averages help smooth out price data to identify trends over a specific period, complementing Heikin-Ashi analysis. They provide a clearer picture of the market’s direction and momentum.
- Bollinger Bands: Bollinger Bands provide a relative definition of high and low prices, aiding in identifying overbought or oversold conditions. They help traders understand market volatility and potential reversal points.
- Relative Strength Index (RSI): The RSI measures the speed and change of price movements, helping to confirm Heikin-Ashi patterns and potential market reversals. It indicates whether an asset is overbought or oversold, guiding trading decisions.
- MACD (Moving Average Convergence Divergence): The MACD indicator helps identify changes in the strength, direction, momentum, and duration of a trend. Combining MACD with Heikin-Ashi charts can provide powerful insights into market dynamics.
Remember: Due to the averaged prices used in Heikin-Ashi charts, they may lag behind actual price movements. So, real-world examples should acknowledge this limitation.
Lessons from Failed Trades
Examining failed trades using Heikin-Ashi charts can be valuable. Analyze examples to identify common mistakes and how to avoid them in future trading. Understanding why a trade failed can provide valuable lessons for improving strategies.
Common Mistakes and How to Avoid Them
Even experienced traders can make errors when interpreting Heikin-Ashi charts. Here are some common mistakes to avoid:
- Misinterpreting Heikin-Ashi Patterns: Correctly interpreting Heikin-Ashi patterns is vital for accurate market predictions and successful trading strategies. Misinterpretation can result in poor trading decisions and potential losses.
- Ignoring Market Context: Always consider the broader market context when analyzing Heikin-Ashi patterns to avoid making isolated or irrelevant interpretations. Understanding the overall market environment, including news events, economic data releases, and industry trends, enhances the accuracy of pattern analysis.
- Overreliance on Heikin-Ashi Alone: While Heikin-Ashi charts are powerful tools, relying solely on them without considering other indicators and market factors can lead to suboptimal trading decisions. A balanced approach using multiple tools like moving averages, Bollinger Bands, or RSI alongside Heikin-Ashi analysis provides a more comprehensive view of the market.
Advanced Tips for Mastering Heikin-Ashi Charts
To truly master Heikin-Ashi charts, traders should continuously refine their skills and strategies. Here are some advanced techniques to consider:
Developing a Trading Strategy with Heikin-Ashi: Each trader should develop a personalized strategy that suits their risk tolerance and trading style, incorporating Heikin-Ashi chart analysis. A well-defined strategy helps in making consistent and informed trading decisions based on Heikin-Ashi patterns and confirmations from other indicators.
Using Advanced Software Tools: Advanced trading software can enhance Heikin-Ashi chart analysis by providing real-time data, pattern recognition tools, and automated trading signals based on Heikin-Ashi patterns and other indicators. These tools can increase efficiency and accuracy in trading while saving time on manual analysis.
Continuous Learning and Adaptation
The financial markets are constantly evolving, so traders must stay informed and adaptable. Here are some ways to achieve this:
Stay Updated on Market Trends: Regularly follow financial news and analysis to stay updated on current market conditions and emerging trends.
Backtest Strategies: Before risking real capital, test your trading strategies using historical data with Heikin-Ashi charts and other indicators. This helps evaluate the effectiveness of your approach and identify areas for improvement.
Practice with a Demo Account: Open a demo account with a binary options broker to practice using Heikin-Ashi charts and your trading strategy in a simulated environment. This allows you to gain experience and refine your skills without risking real money.
Conclusion
Heikin-Ashi charts are a powerful tool in binary options trading, offering valuable insights into market behavior and helping traders make informed decisions. However, it’s crucial to remember the inherent risks involved in binary options trading. By understanding the strengths and limitations of Heikin-Ashi charts, using them in conjunction with other technical indicators, and practicing sound risk management techniques, traders can increase their chances of success in the binary options market.
Final Thoughts on the Use of Heikin-Ashi in Binary Options Trading
While Heikin-Ashi charts can be a valuable tool, they should not be considered a guaranteed path to riches in binary options trading. Success in this market requires a combination of knowledge, skill, experience, and effective risk management. By mastering Heikin-Ashi analysis and employing a well-rounded trading approach, traders can position themselves for better decision-making and potentially achieve their trading goals.
Further reading: