Contents
Binary option indicators are essential tools for traders, offering insights into market trends, momentum, and potential price movements. These mathematical formulas, based on price and volume, help traders make more informed decisions by highlighting patterns and signals within the market. Key indicators like moving averages for trend recognition and the Relative Strength Index (RSI) for momentum tracking are fundamental for strategizing trades in binary options. Understanding and utilizing these indicators effectively can significantly enhance a trader’s ability to predict market behavior accurately during technical analysis and increase the odds of successful trades.
Types of Indicator used for technical analysis
Trend Indicators: These indicators help traders identify the direction and strength of a market trend. Examples include Moving Averages (MA), Moving Average Convergence Divergence (MACD), and the Average Directional Index (ADI).
Volatility Indicators: They measure the rate of price movements, indicating how much an asset’s price is changing. Common volatility indicators are Bollinger Bands and the Average True Range (ATR).
Momentum Indicators: Used to understand the speed of price movements, momentum indicators signal whether an asset is overbought or oversold. This category includes the Relative Strength Index (RSI) and the Stochastic Oscillator.
Volume Indicators: These indicators assess the volume of trade to confirm the strength of a price trend or spot reversals. Volume indicators include the On-Balance Volume (OBV) and the Volume Rate of Change.
Top 5 technical indicators used for binary options trading
Here is a list of the best indicators commonly used to trade binary options:
- Moving Averages (MA): This indicator smooths out price data to create a single flowing line, making it easier to identify the direction of the trend. Traders often use several different period lengths to analyze short and long-term trends.
- Average True Range (ATR): The ATR measures market volatility by decomposing the entire range of an asset price for that period. It’s crucial for determining entry and exit points in the market based on volatility levels.
- Moving Average Convergence/Divergence (MACD): A trend-following momentum indicator that shows the relationship between two moving averages of a security’s price. The MACD is used to identify bullish or bearish momentum and potential reversal points.
- Relative Strength Index (RSI): A momentum oscillator that measures the speed and change of price movements. RSI values range from 0 to 100, and it is often used to identify overbought or oversold conditions.
- Stochastics: An indicator that compares a particular closing price of an asset to a range of its prices over a certain period of time. The sensitivity of the oscillator to market movements is reducible by adjusting that time period or by taking a moving average of the result.
Keep reading to get more details about these indicators and how they can help you spot opportunities in binary options trading.
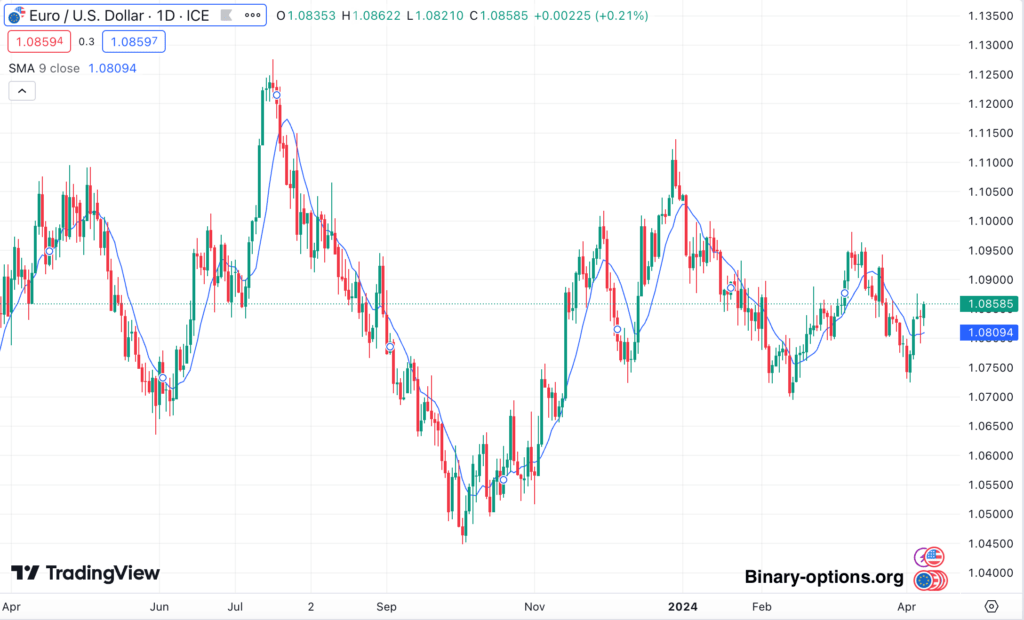
Moving Averages
Type of indicator: Trend
Moving averages smooth out price data to show trend direction. They update with new price data, making them useful for seeing the overall direction of price movement. There are simple moving averages (SMA) and exponential moving averages (EMA). SMA calculates the average price over a set period, often using closing prices. EMA gives more weight to recent prices, making it quicker to react to price changes. Moving averages are usually used with other indicators for a fuller understanding of market trends.
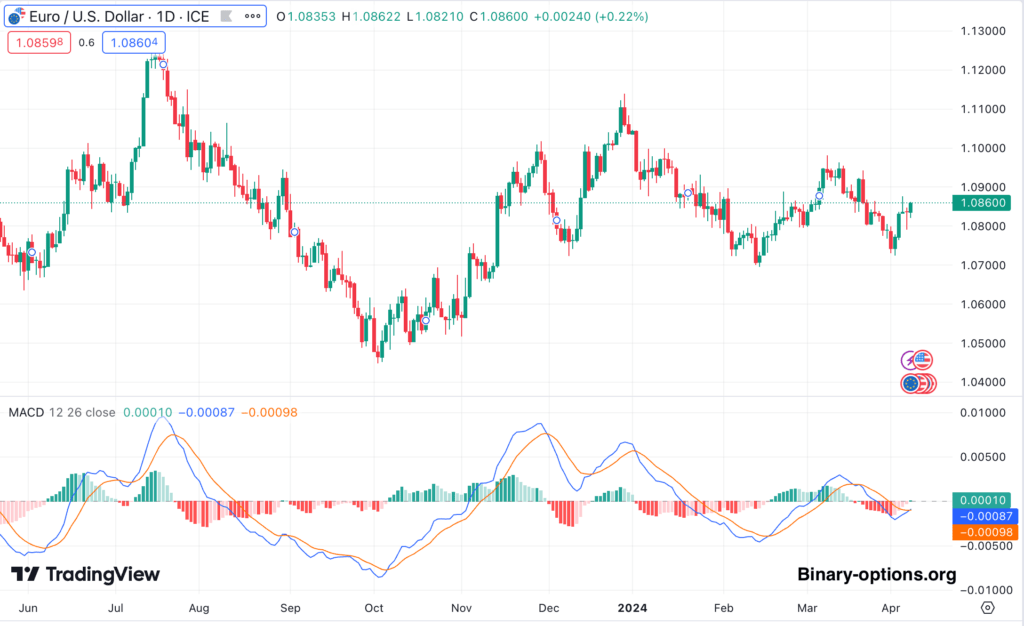
To use the Moving Average Convergence/Divergence (MACD) effectively, observe the interaction between the MACD line (the difference between two moving averages) and the signal line (a moving average of the MACD line). When the MACD line crosses above the signal line, it suggests a potential buying opportunity as the asset’s price might increase. Conversely, when the MACD line crosses below the signal line, it might be time to sell as the price could be heading down. The divergence between the MACD and the asset price also provides insights; if the price is making new highs while MACD is not, it could indicate weakening momentum. This tool helps in identifying trend direction and potential reversal points, assisting in decision-making for entry and exit points in trading.
Average True Range (ATR)
Type of indicator: Volatility
The Average True Range (ATR) measures market volatility by looking at the extent of price movements over a set period, usually 14 days. Higher ATR values mean more volatility. While ATR is good at showing how much prices move, it doesn’t indicate the direction of the movement. This information is useful in binary options for understanding how much an asset might move.
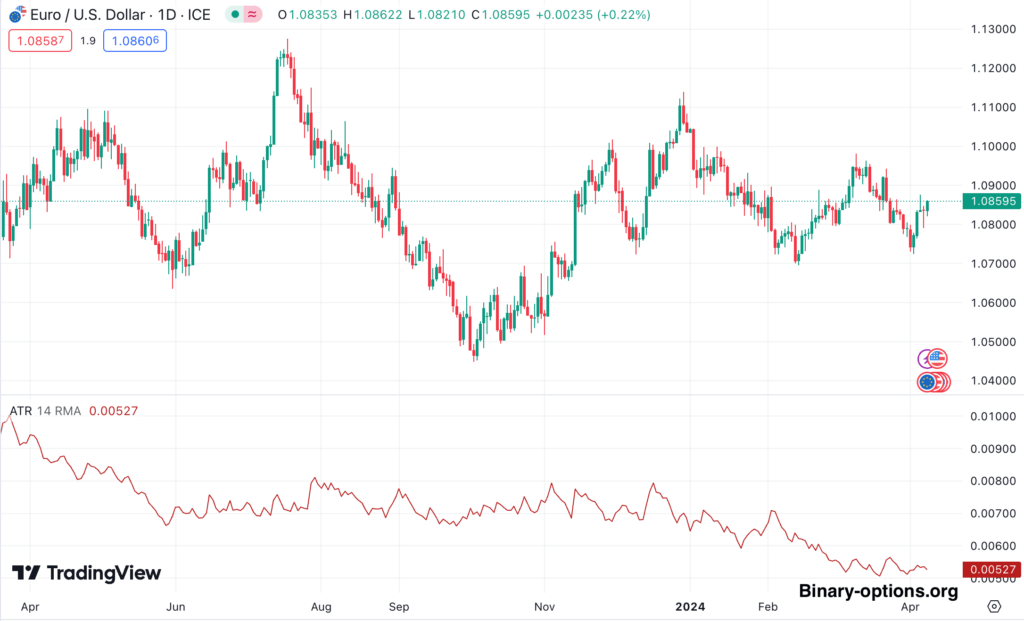
Average True Range (ATR) is a volatility indicator used in binary options trading to measure the degree of price movement within a market. It calculates the average range between the high and low prices over a specified period, typically 14 days. A higher ATR value indicates higher volatility, while a lower value suggests lower volatility. Traders can use ATR to assess the potential for price movement and adjust their trading strategies accordingly. For instance, when ATR is high, traders might consider wider stop-loss orders to accommodate for larger price swings, while in low ATR environments, tighter stop-loss orders might be more appropriate.
Moving Average Convergence/Divergence (MACD)
Type of indicator: Trend
The Moving Average Convergence/Divergence (MACD) uses a fast line, a slow line, and a histogram to analyze moving averages. It helps identify trend momentum and direction changes. Traders watch for these lines to converge or diverge as signs of new trends or trend reversals. MACD helps traders in binary options by showing potential market movements, aiding in strike price selection.
Moving Averages smooth out price data to create a single flowing line, making it easier to identify the direction of the trend. To use them, you simply plot them on your chart and look for the direction they’re moving (up for an uptrend, down for a downtrend) or for crossovers between short-term and long-term moving averages as potential buy or sell signals. For example, if a short-term moving average crosses above a long-term one, it could indicate the start of an uptrend. They’re best used in markets with a clear direction and can be adjusted for any time period, depending on your binary options trading strategy.
Relative Strength Index (RSI)
Type of indicator: Momentum
The Relative Strength Index (RSI) helps identify overbought or oversold conditions, suggesting when trends might reverse. It’s a momentum oscillator that can signal when to enter or exit based on these conditions. In binary options, using RSI can help decide when to buy or sell contracts based on expected market reversals.
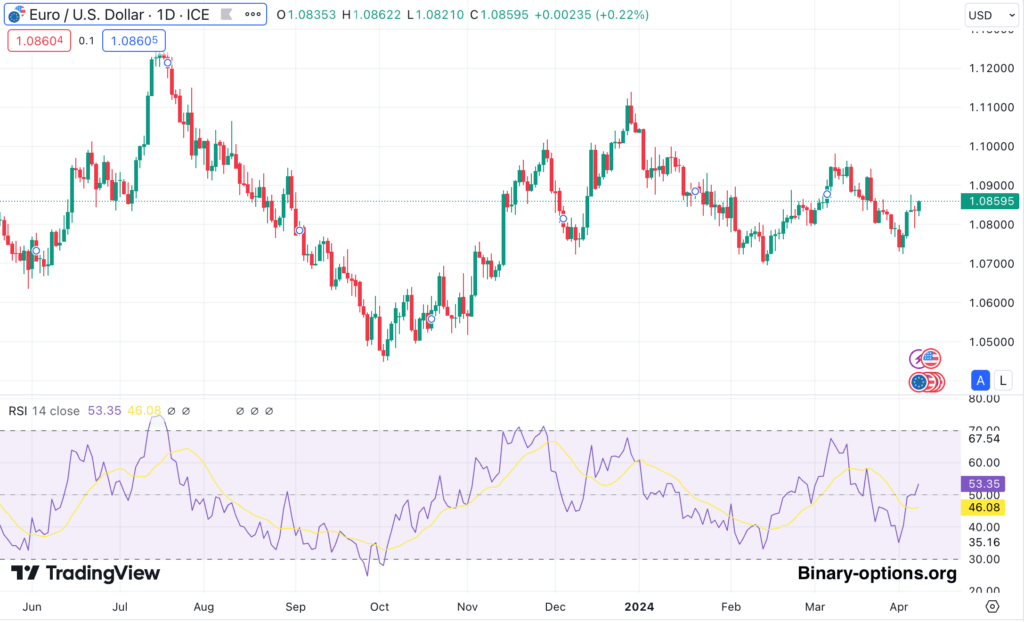
The Relative Strength Index (RSI) measures the magnitude of recent price changes to evaluate overbought or oversold conditions in the price of a stock or other asset. To use RSI, look for readings below 30, which indicate oversold conditions and potential buying opportunities, and readings above 70, indicating overbought conditions and potential selling or shorting opportunities. RSI can also show divergence from price movements, suggesting a potential reversal. For instance, if the price hits a new high but RSI does not, it may signal weakening momentum.
Stochastics
Type of indicator: Momentum
Stochastics indicate overbought or oversold conditions with two trend lines. If the reading is above 80, the market might be overbought and ready for a downtrend. Below 20 suggests an oversold market that might move up. This indicator is useful for predicting trend reversals, aiding in binary options trading decisions.
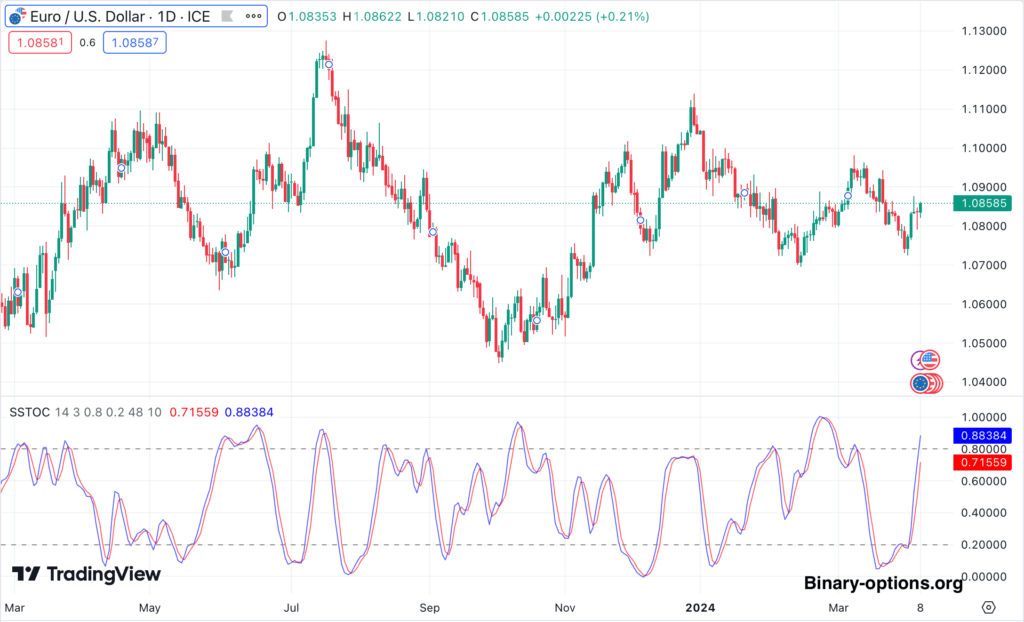
Stochastics is an indicator that measures an asset’s momentum, showing the closing price relative to the asset’s price range over a specific period. It uses a scale of 0 to 100. Reading above 80 usually indicates the asset is overbought—suggesting a potential sell signal—while a reading below 20 indicates the asset is oversold, suggesting a buy signal. Traders look for instances where the %K line (the actual value) crosses above or below the %D line (the moving average of the %K line) within these extreme regions as signals for potential reversals in the current trend.
Tips for using technical indicators
When incorporating technical indicators into your binary options trading strategy, consider the following tips to enhance your trading effectiveness:
Use Demo Accounts: Before applying new indicators in live trading, test them in a demo account. This practice will help you understand their mechanics without risking real money.
Set Realistic Expectations: No indicator provides guaranteed results. Recognize that indicators are tools to assist in decision-making, not foolproof solutions.
Practice Risk Management: Always manage your risk exposure on every trade. Remember that risk management is crucial to long-term trading success.
Combine Indicators: Use multiple indicators to confirm trading signals. For instance, a trend indicator alongside a momentum indicator can validate the strength of a trend.
Understand the Market Conditions: Some indicators perform better under certain market conditions. Identify whether the market is trending or ranging and select your indicators accordingly.
Customize Settings: Adjust the parameters of your indicators to match the specificities of the assets you are trading and your trading time frame.
Keep Learning: Stay updated on new indicators and analytical tools. Continuous learning will help you adapt to changing market conditions.
By following these tips and integrating technical indicators thoughtfully into your trading plan, you can improve your analytical approach and make more informed trading decisions in binary options trading.
Conclusion:
Binary option indicators are indispensable technical analysis tools for traders, providing valuable insights into market dynamics and aiding in the prediction of price movements. These indicators, grounded in mathematical analysis of price and volume data, help identify trends, volatility, momentum, and trade volumes, thereby guiding traders towards more informed decisions. Essential indicators such as Moving Averages and the Relative Strength Index (RSI) play critical roles in strategy formulation, offering perspectives on trend directions and momentum.
Effectively leveraging these indicators, particularly through types like trend, volatility, momentum, and volume indicators, can significantly elevate a trader’s ability to forecast market behaviors and enhance the success rate of their trades. Practical application tips include combining indicators for reinforced signals, tailoring settings to specific market conditions, and continuous learning to adapt strategies to the ever-evolving market. Such thoughtful integration of technical indicators into binary options trading can substantially improve decision-making processes and trading outcomes.