Contents
- 1 Introduction to Price Charts
- 2 Types of Price Charts
- 3 Chart Patterns in Financial Markets
- 4 Technical Indicators and Price Charts
- 5 Time Frames in Price Charts
- 6 Practical Applications of Price Charts in Financial Markets
- 7 Advanced Charting Techniques
- 8 Tools and Software for Chart Analysis
- 9 Conclusion
Financial markets are constantly in flux, with prices of assets like stocks, currencies, and commodities rising and falling. Price charts are essential tools for traders to visualize these price movements and performing technical analysis.
This guide explores various types of price charts, common chart patterns, and how they can be used for analysis in financial markets.
Introduction to Price Charts
Price charts provide a visual representation of price movements of an asset over time. They help traders analyze historical data, identify trends, and make informed trading decisions. Understanding different chart types is crucial for effective market analysis.
Types of Price Charts
There are several popular chart types used in financial markets:
| Chart Type | Description | Advanced Tips |
|---|---|---|
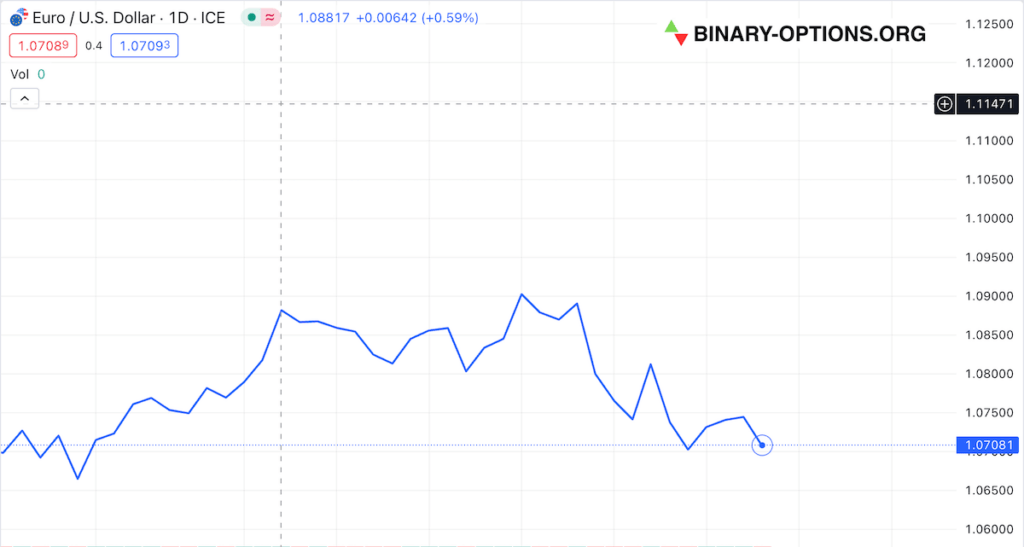
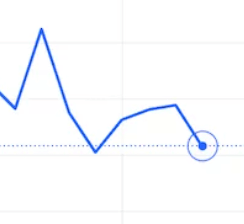 Line Charts | Connects the closing prices of an asset over a specified period. Ideal for identifying long-term trends. | Use different moving averages to gauge trend strength. |
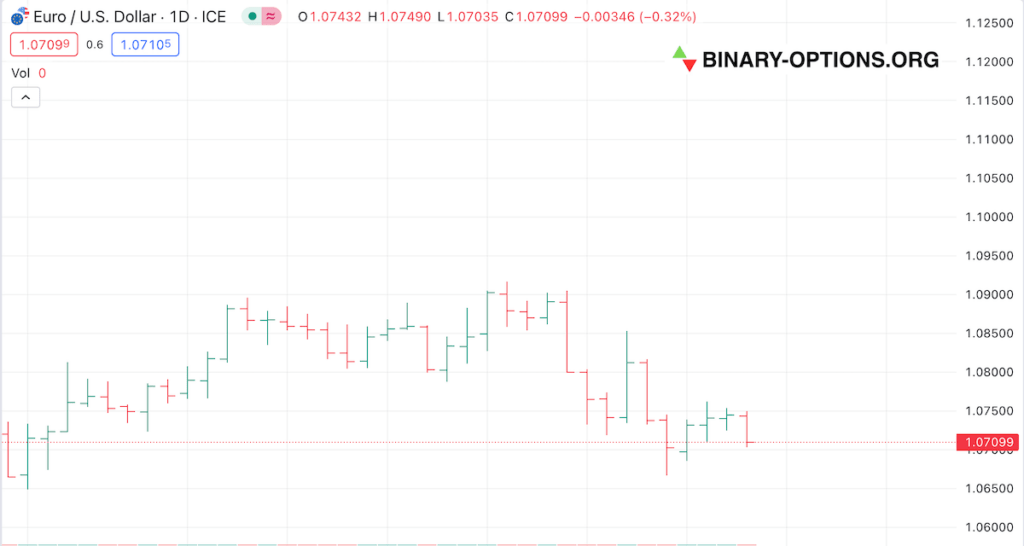
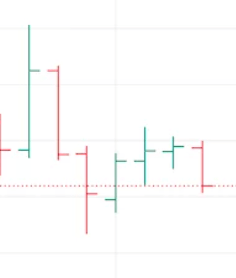 Bar Charts | Displays open, high, low, and close (OHLC) prices for each time period. Shows price volatility and buying/selling pressure. | Large red bars indicate strong selling pressure; large green bars indicate strong buying pressure. |
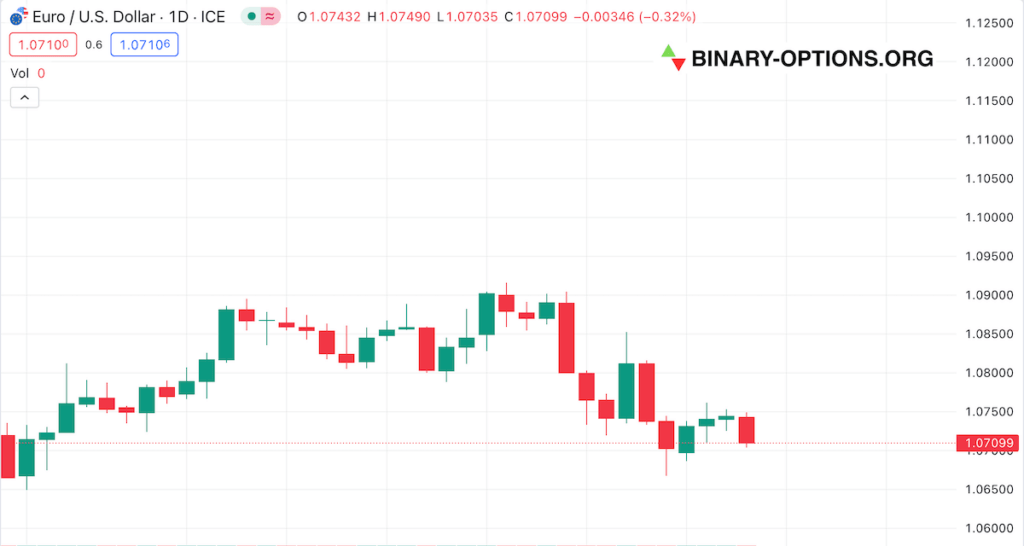
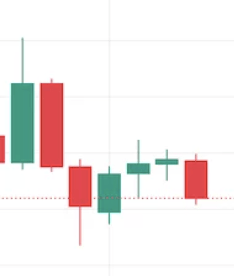 Candlestick Charts | Combines OHLC data with colored “candles” to show bullish (green/white) or bearish (red/black) movements. Excellent for spotting price reversals and market sentiment. | Learn candlestick patterns like hammer, engulfing, and doji to identify potential trend reversals or continuations. |
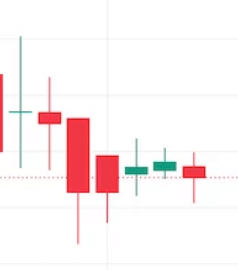 Heikin-Ashi Charts | A variation of candlestick charts that uses averaged price data to create a smoother appearance, making it easier to identify trends and potential reversals. Ideal for filtering out market noise. | Heikin-Ashi candles don’t directly reflect the open, high, low, and close of a single period, so they are less useful for analyzing specific price action. Combine Heikin-Ashi with other technical indicators for confirmation. |
Line Charts: These simple charts connect closing prices over a specific period, forming a continuous line. They are easy to read but lack details about price fluctuations within the period.
Bar Charts: Bar charts offer more information than line charts. Each bar represents a specific period and shows the open, high, low, and close prices. This allows for a more comprehensive understanding of price movements within the timeframe.
Candlestick Charts: Popular among traders, candlestick charts provide a detailed and visually appealing representation of price movements. Each candlestick shows the open, high, low, and close prices for a specific period. The body of the candlestick indicates the price range between the open and close, while the wicks represent the high and low prices. Common candlestick patterns offer insights into potential market reversals or continuations.
Heikin-Ashi Charts: A variation of candlestick charts, Heikin-Ashi charts use modified formulae to provide a clearer picture of the trend by averaging out price data. This can be helpful for identifying trends and potential reversals.
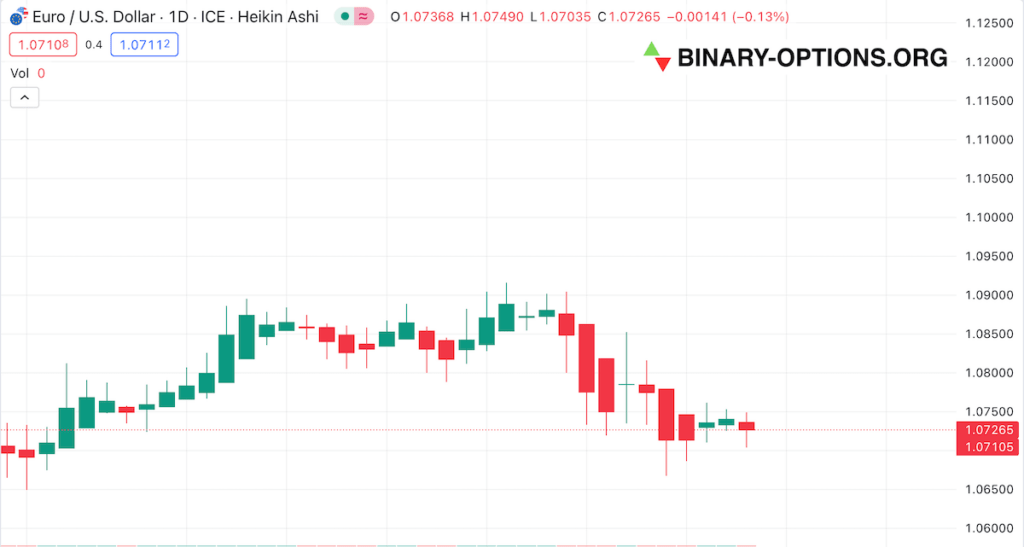
Chart Patterns in Financial Markets
Chart patterns are recurring formations on price charts that can provide clues about potential future price movements. These patterns are not guarantees, but they can be valuable tools for informed trading decisions. Some common chart patterns include:
- Continuation Patterns: These patterns, such as flags, pennants, and triangles, suggest the current trend is likely to continue after a temporary consolidation period.
- Reversal Patterns: Reversal patterns, like head and shoulders, double tops, and triple bottoms, signal a potential change in the trend direction. Recognizing these patterns can help traders anticipate market reversals and adjust their strategies accordingly.
Technical Indicators and Price Charts
Technical indicators are mathematical calculations based on price and volume data that can be used in conjunction with price charts for further analysis. Some popular technical indicators include:
- Moving Averages: Moving averages smooth out price data to identify trends over a specific period. They can help spot trend directions and potential reversals.
- Bollinger Bands: Bollinger Bands consist of a middle band (moving average) and two outer bands representing standard deviations from the middle band. They can help identify overbought or oversold conditions and potential price breakouts.
- Relative Strength Index (RSI): RSI measures the speed and change of price movements, indicating overbought or oversold conditions. It can help identify potential reversal points and entry or exit signals.
- Moving Average Convergence Divergence (MACD): MACD shows the relationship between two moving averages of an asset’s price. It helps identify potential buy or sell signals based on the convergence or divergence of the moving averages.
- Fibonacci Retracements: Fibonacci retracements use horizontal lines to indicate potential support and resistance levels based on key Fibonacci ratios. Traders use these levels to identify potential reversal points in a price trend.
Time Frames in Price Charts
Price charts can be analyzed across different time frames, each offering a unique perspective on the market. Common time frames include:
- Short-term Time Frames: These charts, such as 1-minute, 5-minute, and 15-minute charts, provide detailed insights into price movements within the day, helping traders capitalize on short-term fluctuations.
- Medium-term Time Frames: Hourly and 4-hour charts offer a balance between short-term and long-term analysis. They are useful for swing traders looking to hold positions for several days to weeks.
- Long-term Time Frames: Daily, weekly, and monthly charts are suitable for long-term traders. They provide a broader perspective on market trends and help identify major support and resistance levels.
Practical Applications of Price Charts in Financial Markets
Identifying Trends: Understanding trends is crucial. Uptrends indicate rising prices, downtrends show falling prices, and sideways trends suggest consolidation. Recognizing these trends helps traders align their strategies with the market direction.
Recognizing Support and Resistance Levels: Support levels are price points where buying interest is strong enough to prevent further declines. Resistance levels are where selling interest is strong enough to prevent further advances. Identifying these levels helps traders make informed decisions about entry and exit points for their positions.
Entry and Exit Points: Determining optimal entry and exit points is essential for successful trading. Price charts, along with technical indicators, can help traders identify these points based on trends, support and resistance levels, and risk management strategies (imploring proper position sizing).
Using Chart Patterns for Decision Making: Chart patterns provide visual cues about market psychology and potential price movements. Continuation patterns like flags and triangles suggest the trend will continue, while reversal patterns like head and shoulders signal a potential change in direction. Recognizing these patterns and their implications allows traders to make more informed decisions about when to enter or exit trades.
Incorporating Technical Indicators: Technical indicators, such as moving averages, RSI, MACD, and Bollinger Bands, provide additional layers of information that can enhance chart analysis. These indicators can help confirm trends, identify overbought or oversold conditions, and signal potential entry or exit points. By combining chart patterns with technical indicators, traders can develop robust trading strategies.
Adapting to Market Conditions: Price charts help traders adapt to changing market conditions. For example, during high volatility periods, traders might look for breakout patterns and use indicators like Bollinger Bands to gauge the strength of price movements. In contrast, during low volatility periods, range-bound trading strategies might be more effective. Adapting strategies based on chart analysis ensures traders are better prepared for different market environments.
Advanced Charting Techniques
For experienced traders, there are advanced charting techniques that can further refine analysis:
- Multiple Time Frame Analysis: Analyzing the same asset across different time frames provides a comprehensive view of the market. This approach helps confirm trends and improve the accuracy of trading decisions.
- Price Action Trading: This technique focuses on interpreting raw price movements without relying on indicators. Traders use key price action patterns to make trading decisions.
- Combining Indicators and Chart Patterns: Combining multiple technical indicators and chart patterns can enhance trading strategies.
- Heikin-Ashi Technique: This advanced charting method filters out market noise and provides a clearer picture of trends, potentially aiding in identifying strong trends and reversal points.
- Advanced Pattern Recognition: Identifying complex chart patterns like harmonic patterns can offer high-probability trading opportunities, but requires a strong understanding of chart analysis.
- Synergy Between Indicators: Combining multiple indicators can provide more reliable trading signals.
Tools and Software for Chart Analysis
Several charting software options are available for traders, including MetaTrader, TradingView, and NinjaTrader. These platforms offer various tools and features for in-depth market analysis. When selecting charting tools, consider factors like user interface, customizability, and real-time data availability.
Conclusion
Price charts are indispensable tools in financial markets, providing valuable insights into market movements and aiding informed trading decisions. Continuous learning and practice are essential to mastering chart analysis and improving trading performance. By understanding and utilizing various chart types, chart patterns, technical indicators, and advanced charting techniques, traders can enhance their strategies and navigate the dynamic world of financial markets.
Further reading: