Contents
- 1 Understanding the Basics
- 2 History and Origin of Candlestick Charts
- 3 Importance of Candlestick Charts in Binary Options Trading
- 4 Anatomy of a Candlestick
- 5 Types of Candlestick Patterns
- 6 Practical Examples and Case Studies
- 7 Common Mistakes and How to Avoid Them
- 8 Advanced Tips for Mastering Candlestick Charts
- 9 Conclusion
Candlestick charts are an essential tool for traders of all experience levels, and particularly valuable in the fast-paced world of binary options trading. Their visual appeal and ability to condense key price information into a single bar make them perfect for identifying short-term trends and potential price reversals in price charts, crucial for success in binary options with expiry times in minutes or hours. Unlike traditional stock trading where you aim to buy low and sell high, binary options involve predicting whether the price of an asset (currency, stock, etc.) will be higher or lower at a specific time in the future. Candlestick charts help you make those predictions with more confidence.
This guide will provide a comprehensive overview of candlestick charts, focusing on the patterns most relevant to binary options trading, and how to use them to develop effective trading strategies. Remember, binary options trading involves a high degree of risk, and there is no guarantee of profits.
Understanding the Basics
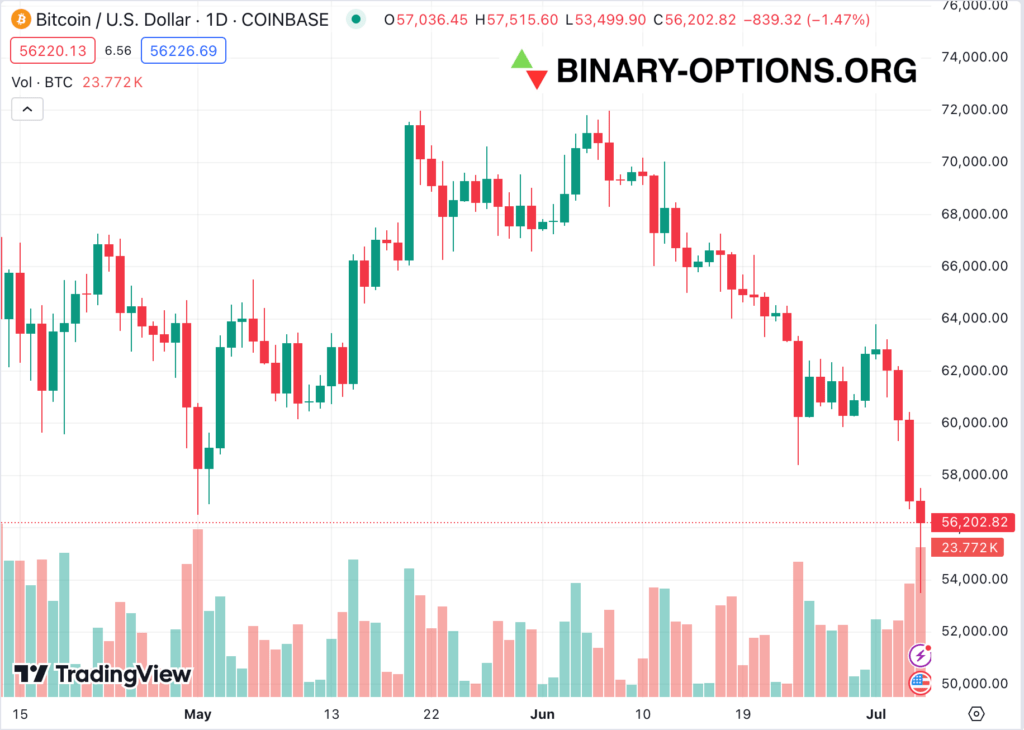
Candlestick charts represent price movements over a specific period, using individual candlesticks to show the opening, closing, high, and low prices. Each candlestick provides a snapshot of market sentiment, which traders use to make informed decisions about whether to place a “call” option (predicting a price increase) or a “put” option (predicting a price decrease) before the expiry time. These charts are particularly useful for identifying short-term trends and potential reversals in the fast-moving world of binary options.
Here’s a tip: As you learn about candlestick patterns, try sketching them out yourself to solidify your understanding.
History and Origin of Candlestick Charts

Originating in Japan over 300 years ago, candlestick charts were developed by rice traders to track and predict market prices. The methodology was introduced to the Western world by Steve Nison in the late 20th century and has since become a cornerstone of technical analysis. The historical reliability and intuitive nature of these charts have made them a preferred tool for traders globally.
Importance of Candlestick Charts in Binary Options Trading
Candlestick charts offer a clear and concise way to observe short-term market trends, identify potential reversals within the expiry window of your binary options, and confirm continuation patterns. They provide visual insights into market psychology, reflecting the buying and selling pressures that drive price movements. By analyzing the patterns formed by these candlesticks, traders can gain a deeper understanding of market dynamics and make more informed decisions about entering or exiting binary option positions.
Anatomy of a Candlestick
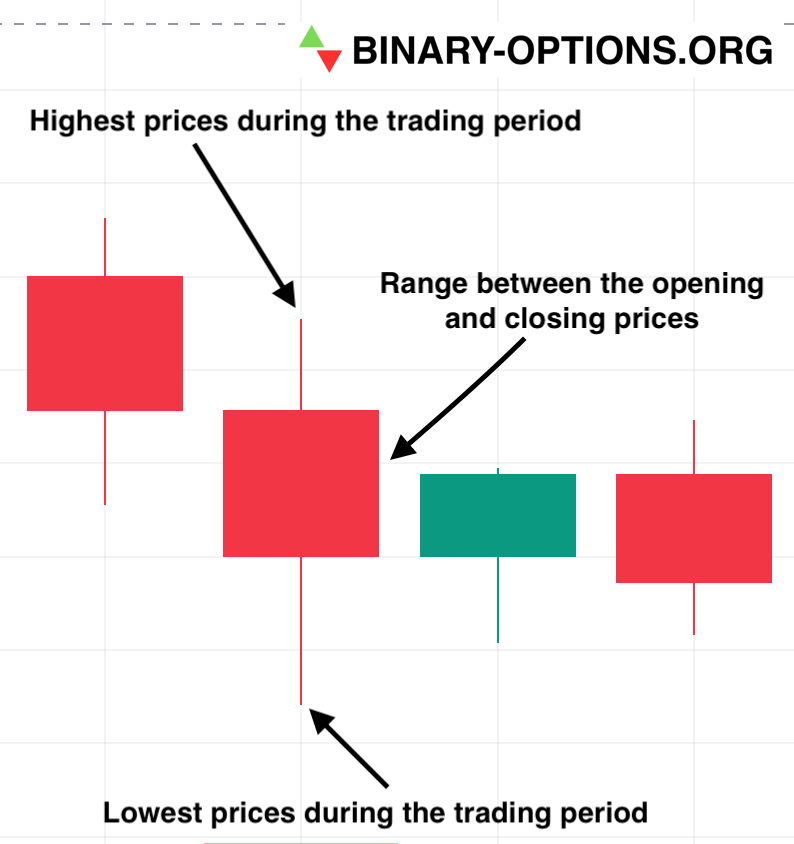
Understanding the components of a candlestick is crucial for interpreting the charts correctly. Each candlestick reflects a specific period of trading, providing a visual representation of price action.
- The Body: The body of the candlestick represents the range between the opening and closing prices. A filled (or red) body indicates a bearish market (closing price lower than opening), while a hollow (or green) body indicates a bullish market (closing price higher than opening). The size and color of the body provide insights into the strength of the market sentiment.
- The Wick (Shadow): The wick, or shadow, shows the highest and lowest prices during the trading period. The upper shadow extends from the top of the body to the high, and the lower shadow extends from the bottom of the body to the low. The length of the shadows can indicate the volatility and strength of price movements. Longer shadows often suggest higher volatility and indecisiveness in the market.
- Open, High, Low, Close (OHLC) Data Points: Each candlestick incorporates four critical data points: the open, high, low, and close prices, abbreviated as OHLC. These points are essential for constructing and interpreting candlestick charts. Understanding these data points helps traders grasp the range and dynamics of price movements within a specific period, crucial for making time-sensitive decisions in binary options trading.
Types of Candlestick Patterns
Candlestick patterns are formed by one or more candlesticks and can indicate market trends or potential reversals within the timeframe of your binary options contract. Recognizing these patterns is key to successful trading.
We’ll focus on some of the most common and relevant patterns for binary options trading:
- Doji: A doji occurs when the opening and closing prices are nearly equal, with a small body and long shadows. It suggests market indecision, and depending on the context, could signal a potential reversal or continuation of the current trend.
- Hammer: A bullish reversal pattern that forms after a downtrend. It has a small body and a long lower shadow, indicating selling pressure that was ultimately overcome by buyers, potentially leading to a price increase within your binary option contract timeframe.
- Hanging Man: The opposite of a hammer, this bearish reversal pattern appears after an uptrend. It has a small body and a long upper shadow, suggesting that despite buying pressure, sellers are starting to take control, potentially leading to a price decrease before your option expires.
- Engulfing Patterns: These two-candlestick patterns signal a potential shift in momentum.
- Bullish Engulfing: A small bearish candlestick is followed by a larger bullish candlestick, engulfing the previous candle’s body. This suggests a strong surge in buying pressure, potentially indicating an upward trend within the scope of your binary option.
- Bearish Engulfing: The opposite of the bullish engulfing pattern. A small bullish candlestick is followed by a larger bearish candlestick, engulfing the previous candle’s body. This signifies a potential takeover by sellers and a possible downward price movement before your option expires.
Practical Examples and Case Studies
While theoretical knowledge is valuable, applying it to real-world scenarios is essential for effective binary options trading. Here are some ways to bridge the gap:
- Analyze Past Trades: Examine historical charts with successful trades identified by specific candlestick patterns. This can help you visualize how these patterns translated into profitable outcomes.
- Simulate Trading: Many binary options platforms offer demo accounts with simulated trading. This allows you to practice using candlestick analysis in a risk-free environment before trading with real money.
Common Mistakes and How to Avoid Them
Even experienced traders can make mistakes when interpreting candlestick charts. Here are some common pitfalls to be aware of:
- Overlooking Important Patterns: Focus on honing your pattern recognition skills to avoid missing opportunities or making incorrect decisions based on incomplete information.
- Misinterpreting Candlestick Formations: Ensure you thoroughly understand each pattern’s characteristics to make accurate predictions about price movements within your binary option’s timeframe.
- Ignoring Market Context: Don’t analyze candlestick patterns in isolation. Consider broader market trends and news events that might influence price movements.
Advanced Tips for Mastering Candlestick Charts
- Develop a Personal Trading Strategy: Tailor your trading approach to your risk tolerance and trading style. Candlestick analysis should be one component of your overall strategy.
- Utilize Advanced Software Tools: Many trading platforms offer advanced charting software with features like pattern recognition tools and automated indicators that can complement your candlestick analysis.
- Continuous Learning and Adaptation: The financial markets are dynamic, so stay updated on new trading techniques and market trends.
Conclusion
Candlestick charts are a powerful tool for binary options traders, offering valuable insights into short-term price movements. By understanding candlestick patterns and incorporating them into your trading strategies, you can increase your chances of success. Remember, binary options trading involves a significant degree of risk, and this guide is intended to be educational, not financial advice.
I hope this enhanced guide empowers you to navigate the exciting world of binary options trading with more confidence!
Further reading: